The big picture
Analyzing multivariable relationships + Reproducibility
Announcements
- Office hours start this week
- See office hours schedule on Canvas
- Complete Lab 00 tasks
- Introduction to R workshops at Duke library
- Data wrangling with dplyr - Thu, Jan 16 at 12pm
- Data visualization with ggplot2 - Thu, Jan 23 at 12pm
Questions from last class?
Topics
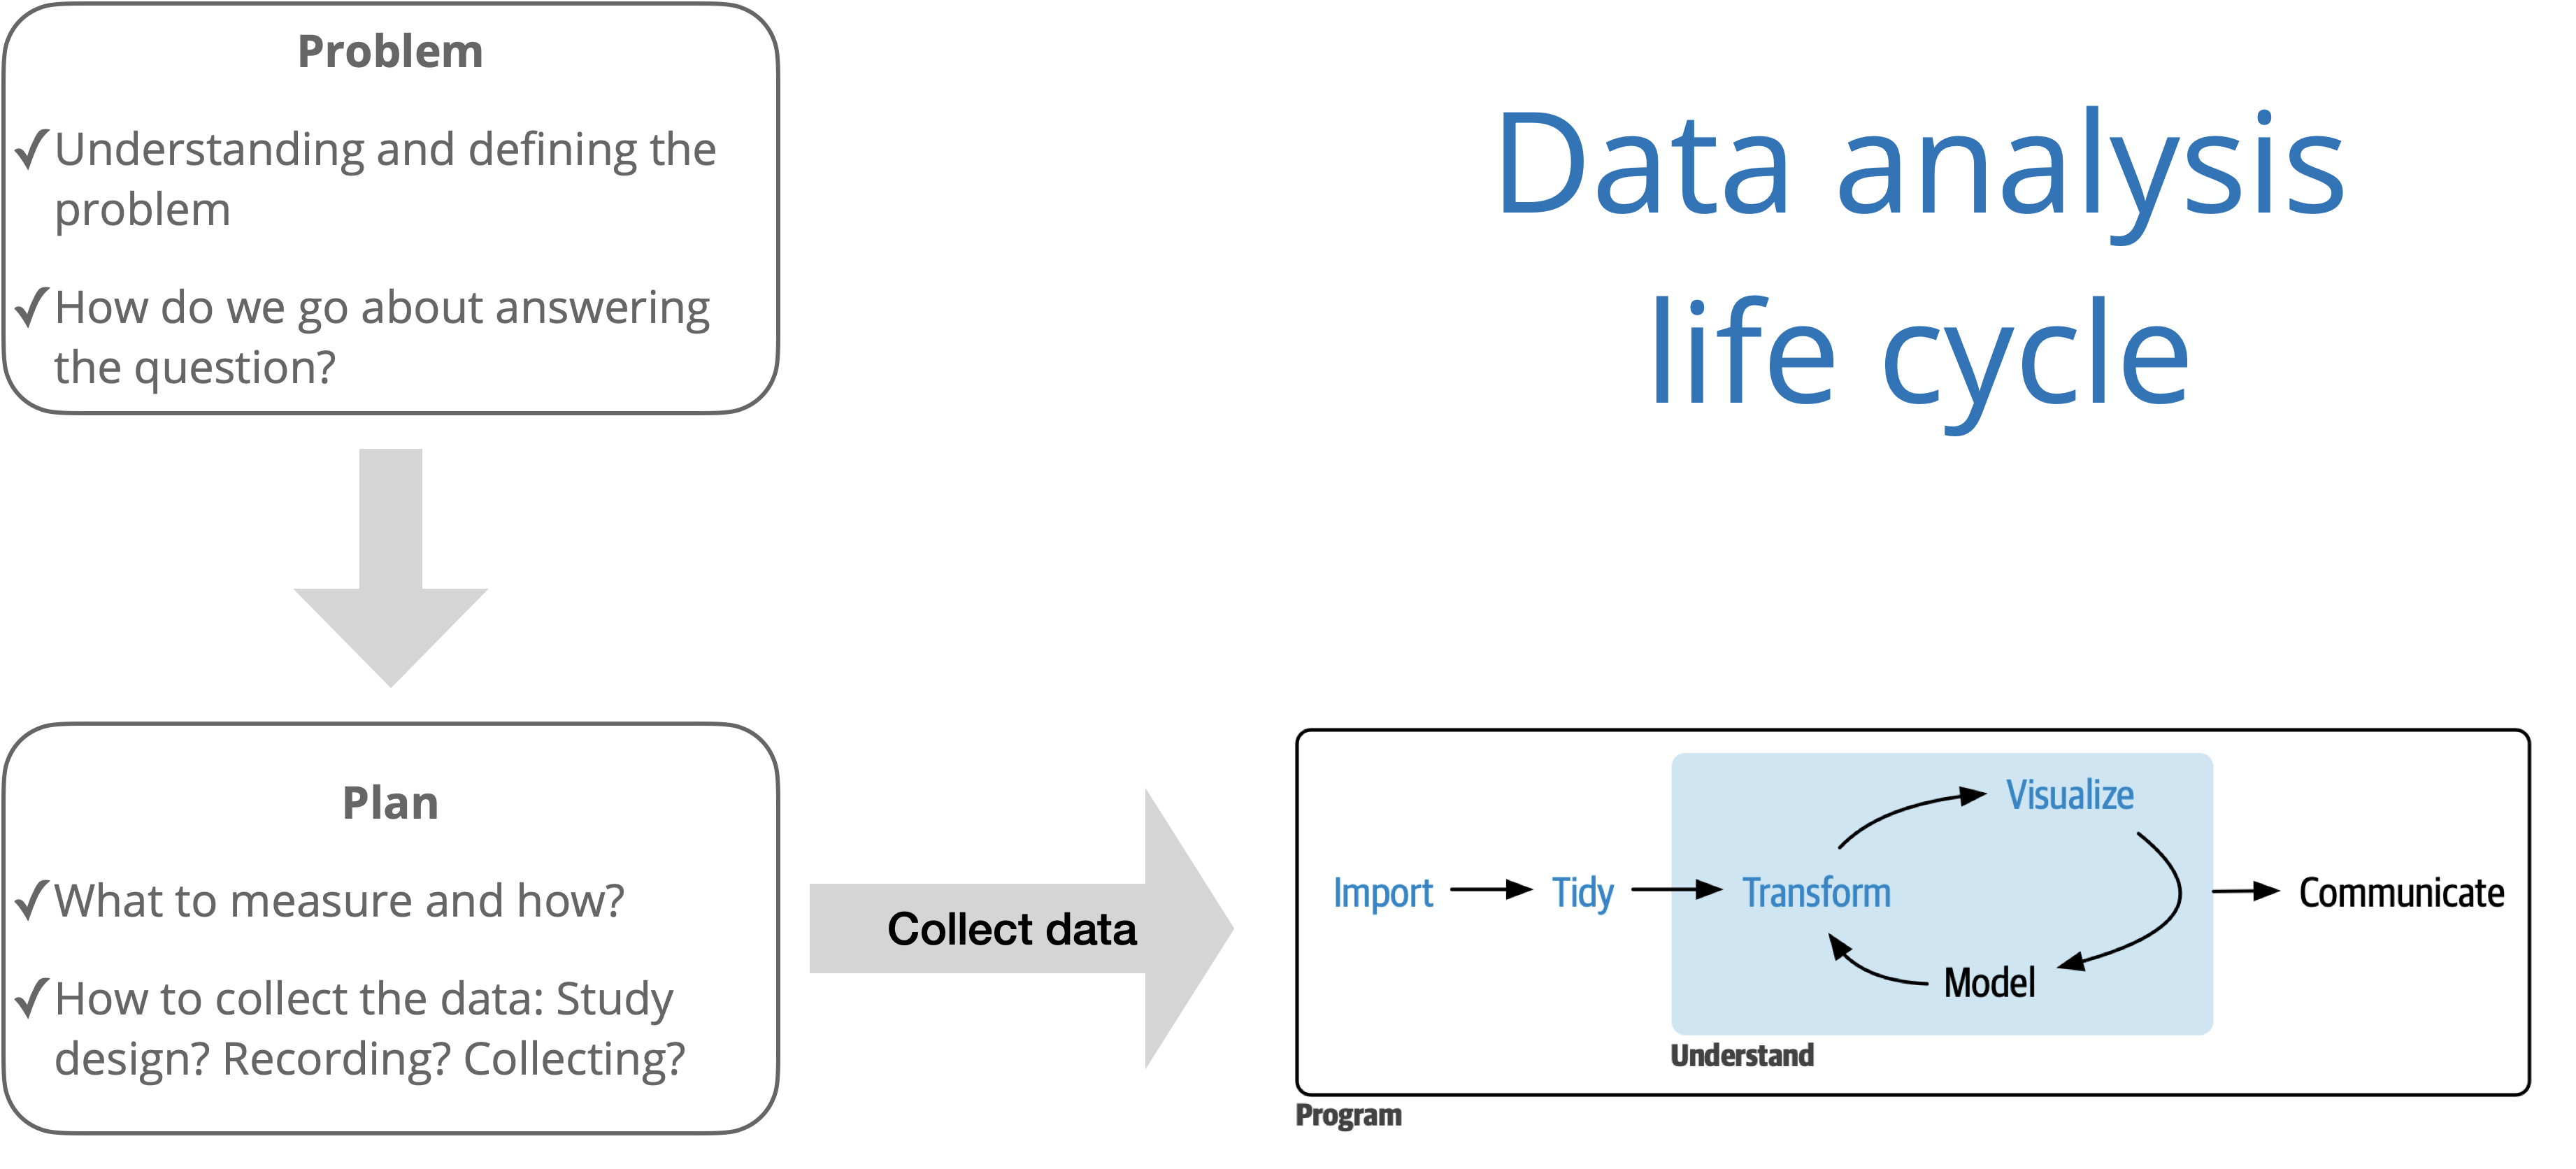
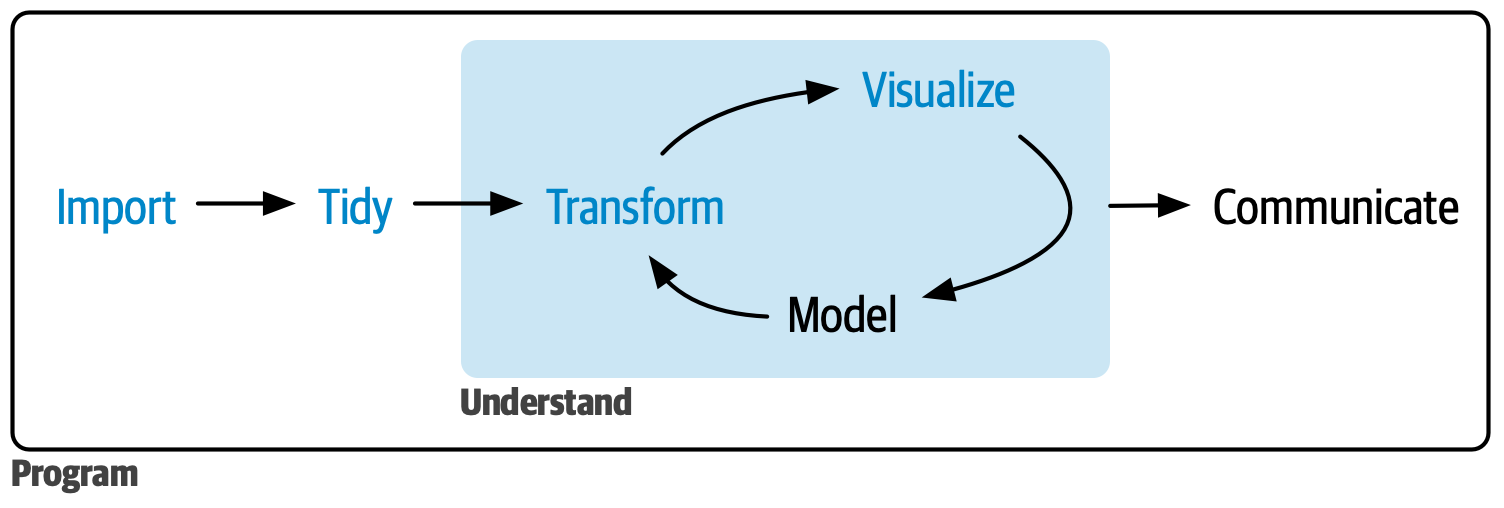
- Data analysis life cycle
- Reproducible data analysis
- Analyzing multivariable relationships
Reproducibility
Reproducibility checklist
What does it mean for an analysis to be reproducible?
. . .
Near term goals:
✔️ Can the tables and figures be exactly reproduced from the code and data?
✔️ Does the code actually do what you think it does?
✔️ In addition to what was done, is it clear why it was done?
. . .
Long term goals:
✔️ Can the code be used for other data?
✔️ Can you extend the code to do other things?
Why is reproducibility important?
Results produced are more reliable and trustworthy (Ostblom and Timbers 2022)
Facilitates more effective collaboration (Ostblom and Timbers 2022)
Contributing to science, which builds and organizes knowledge in terms of testable hypotheses (Alexander 2023)
Possible to identify and correct errors or biases in the analysis process (Alexander 2023)
Why is reproducibility important?

Originally reported “the intervention, compared with usual care, resulted in a fewer number of mean COPD-related hospitalizations and emergency department visits at 6 months per participant.”
There were actually more COPD-related hospitalizations and emergency department visits in the intervention group compared to the control group
Mixed up the intervention vs. control group using “0/1” coding
Toolkit
Scriptability \(\rightarrow\) R
Literate programming (code, narrative, output in one place) \(\rightarrow\) Quarto
Version control \(\rightarrow\) Git / GitHub
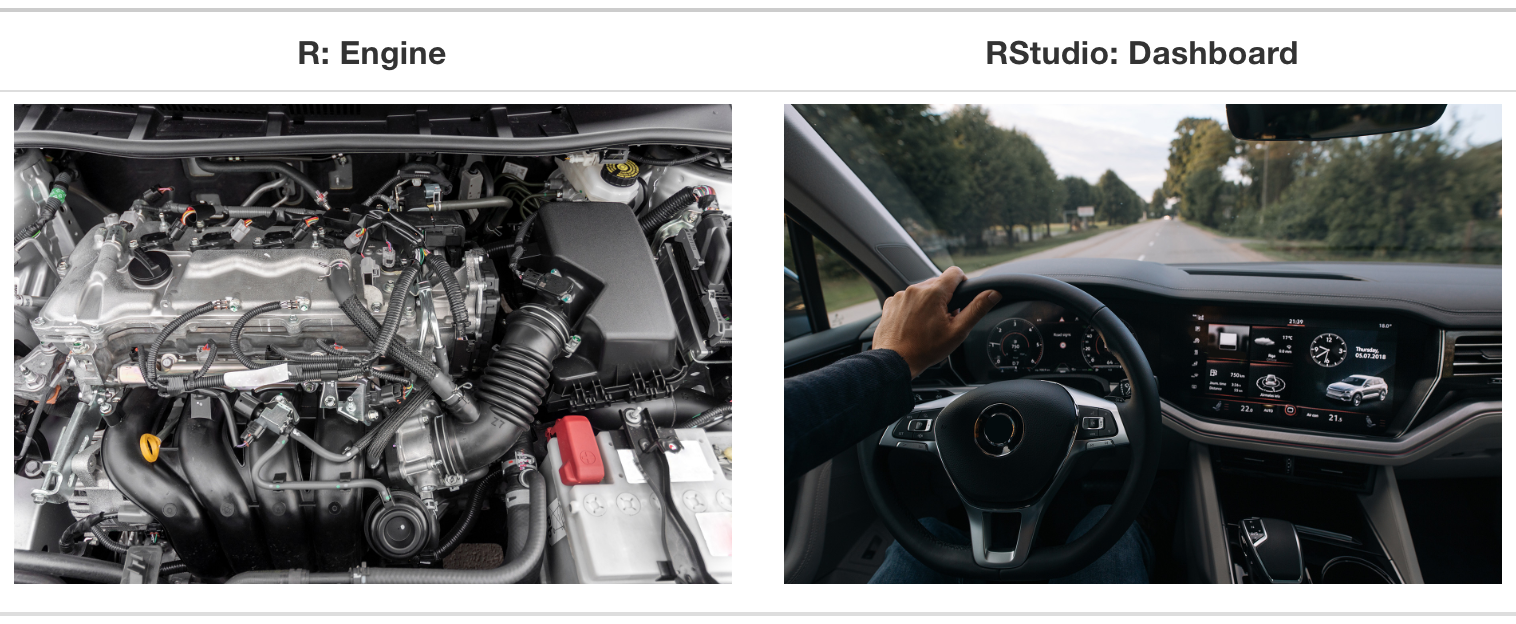
R and RStudio
R is a statistical programming language
RStudio is a convenient interface for R (an integrated development environment, IDE)
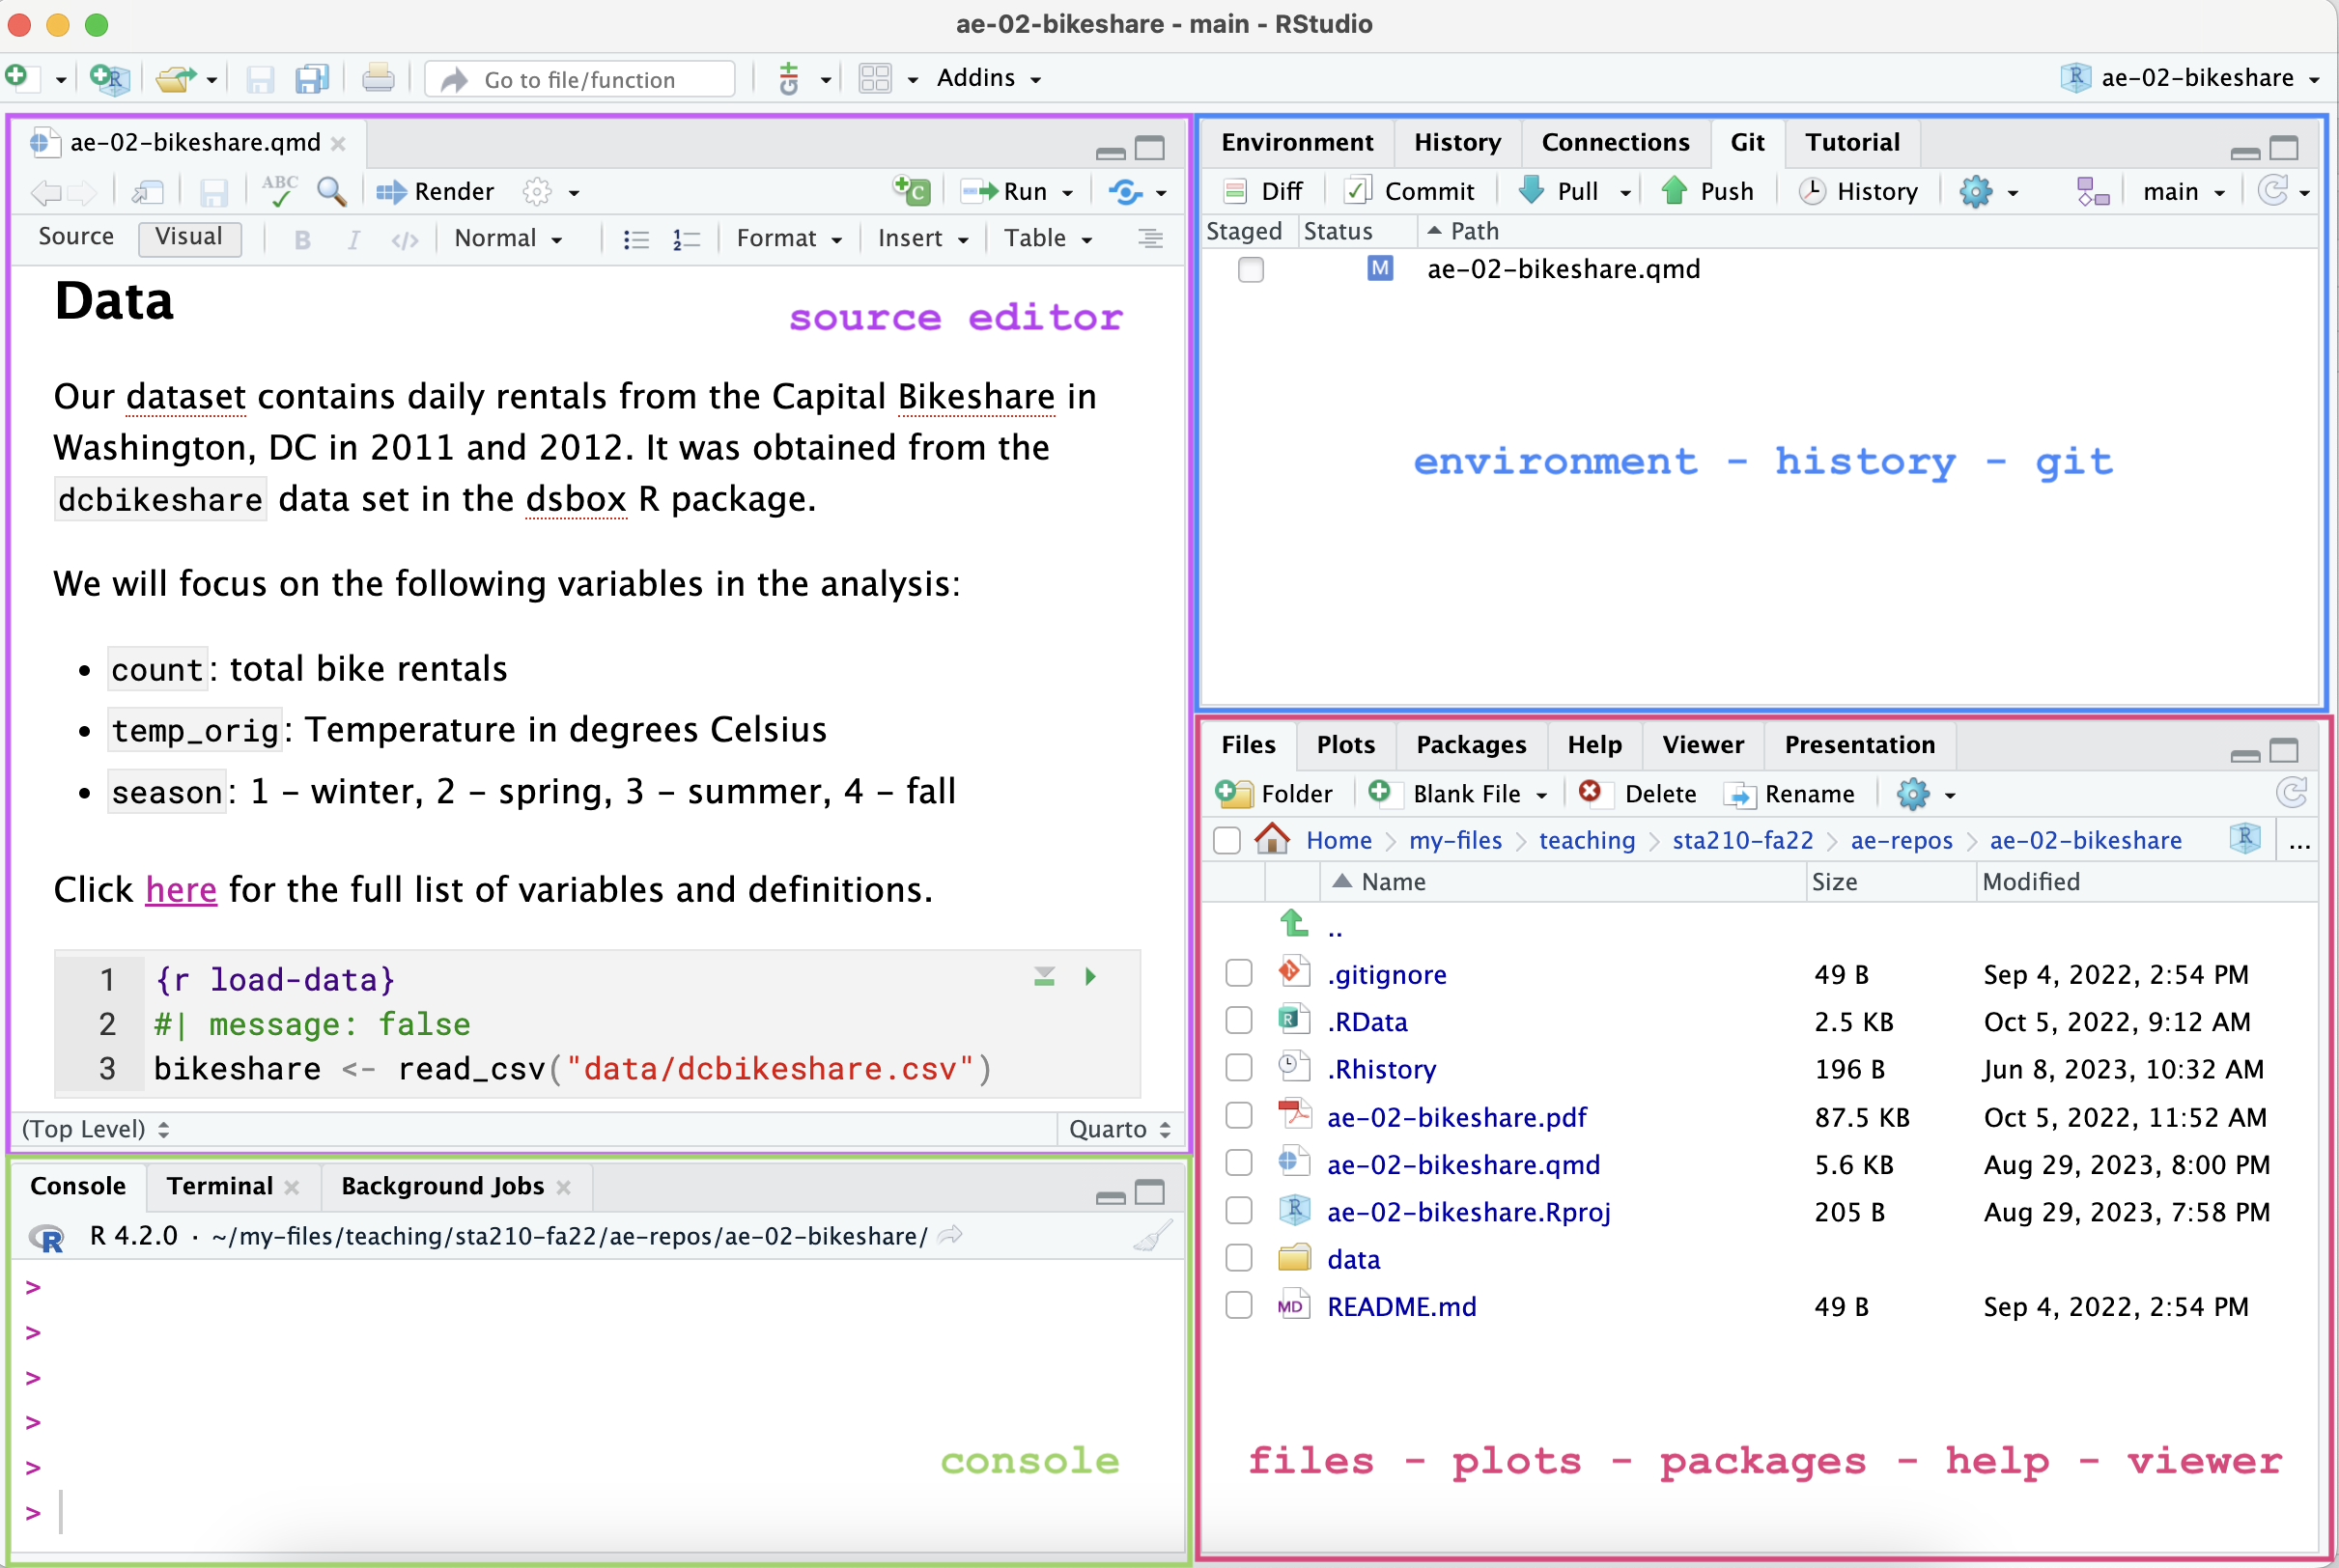
RStudio IDE
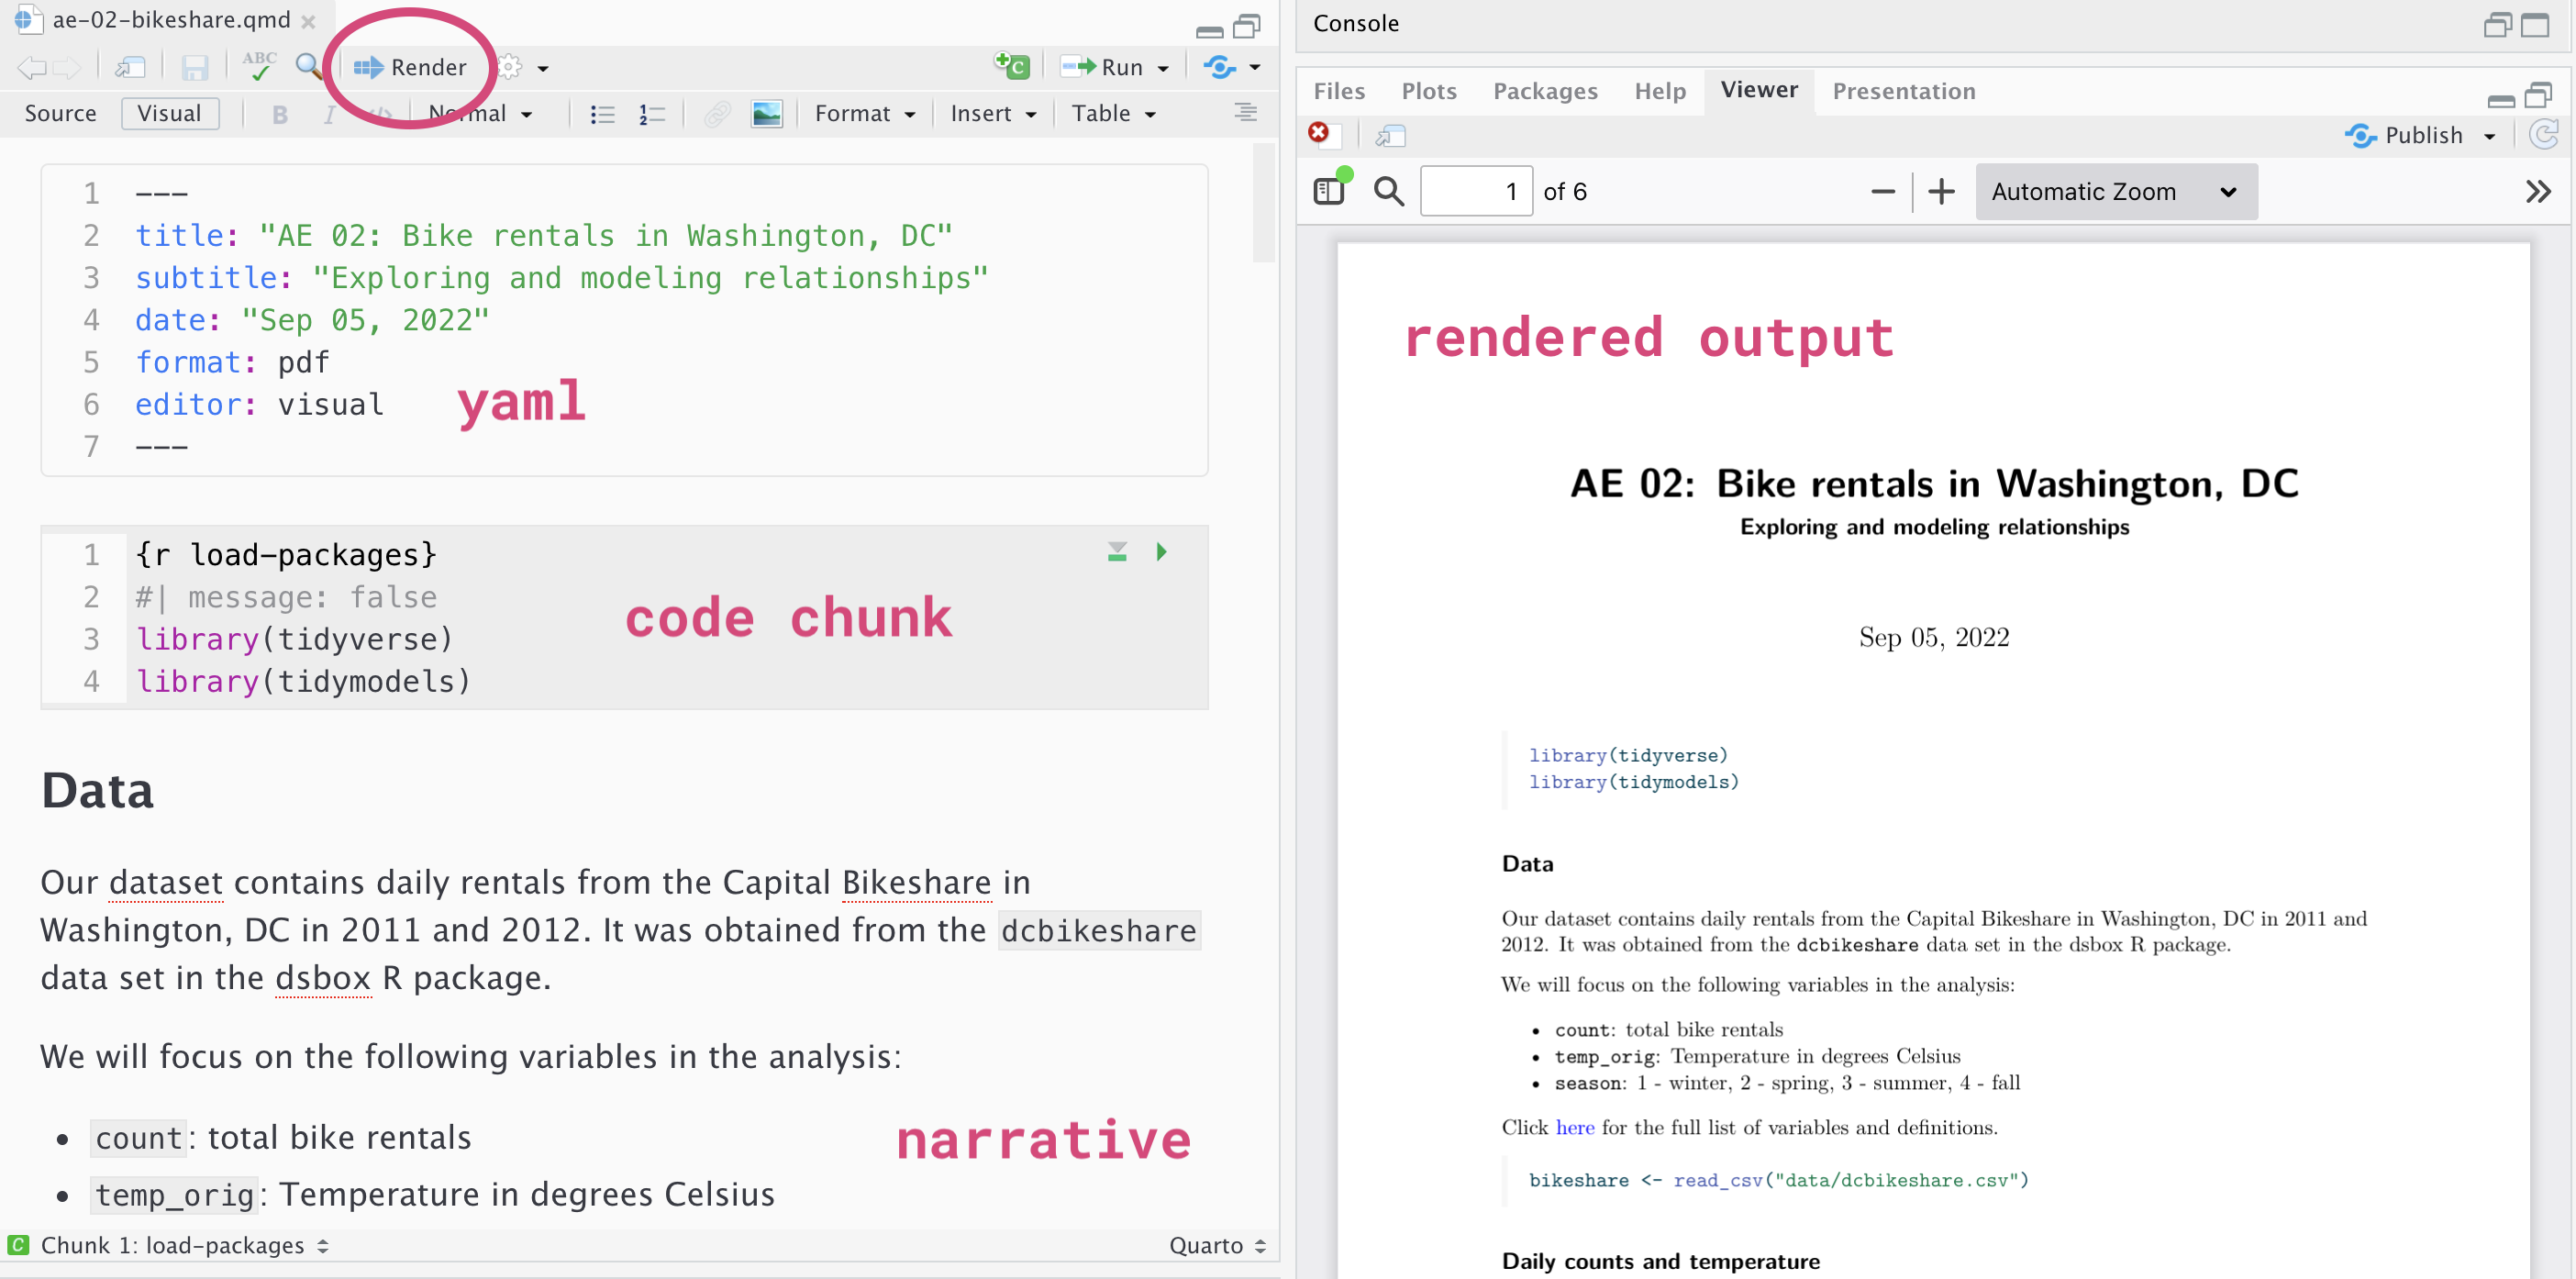
Quarto
Fully reproducible reports – the analysis is run from the beginning each time you render
Code goes in chunks and narrative goes outside of chunks
Visual editor to make document editing experience similar to a word processor (Google docs, Word, Pages, etc.)
Quarto
How will we use Quarto?
Every application exercise and assignment is written in a Quarto document
You’ll have a template Quarto document to start with
The amount of scaffolding in the template will decrease over the semester
Version control with git and GitHub
What is versioning?
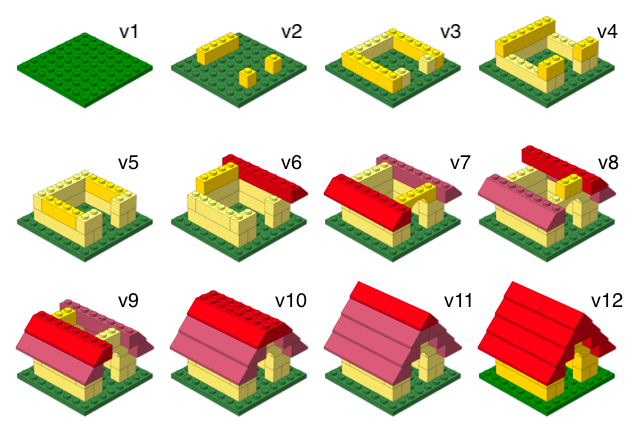
What is versioning?
with human readable messages

Why do we need version control?
Provides a clear record of how the analysis methods evolved. This makes analysis auditable and thus more trustworthy and reliable. (Ostblom and Timbers 2022)
git and GitHub

- git is a version control system – like “Track Changes” features from Microsoft Word.
- GitHub is the home for your git-based projects on the internet (like DropBox but much better).
- There are a lot of git commands and very few people know them all. 99% of the time you will use git to add, commit, push, and pull.
Multivariable relationships
Education and life expectancy
The data set comes from Zarulli et al. (2021) who analyze the effects of a country’s healthcare expenditures and other factors on the country’s life expectancy. The data are originally from the Human Development Database and World Health Organization.
There are 140 countries (observations) in the data set.
Click here for the original research paper.
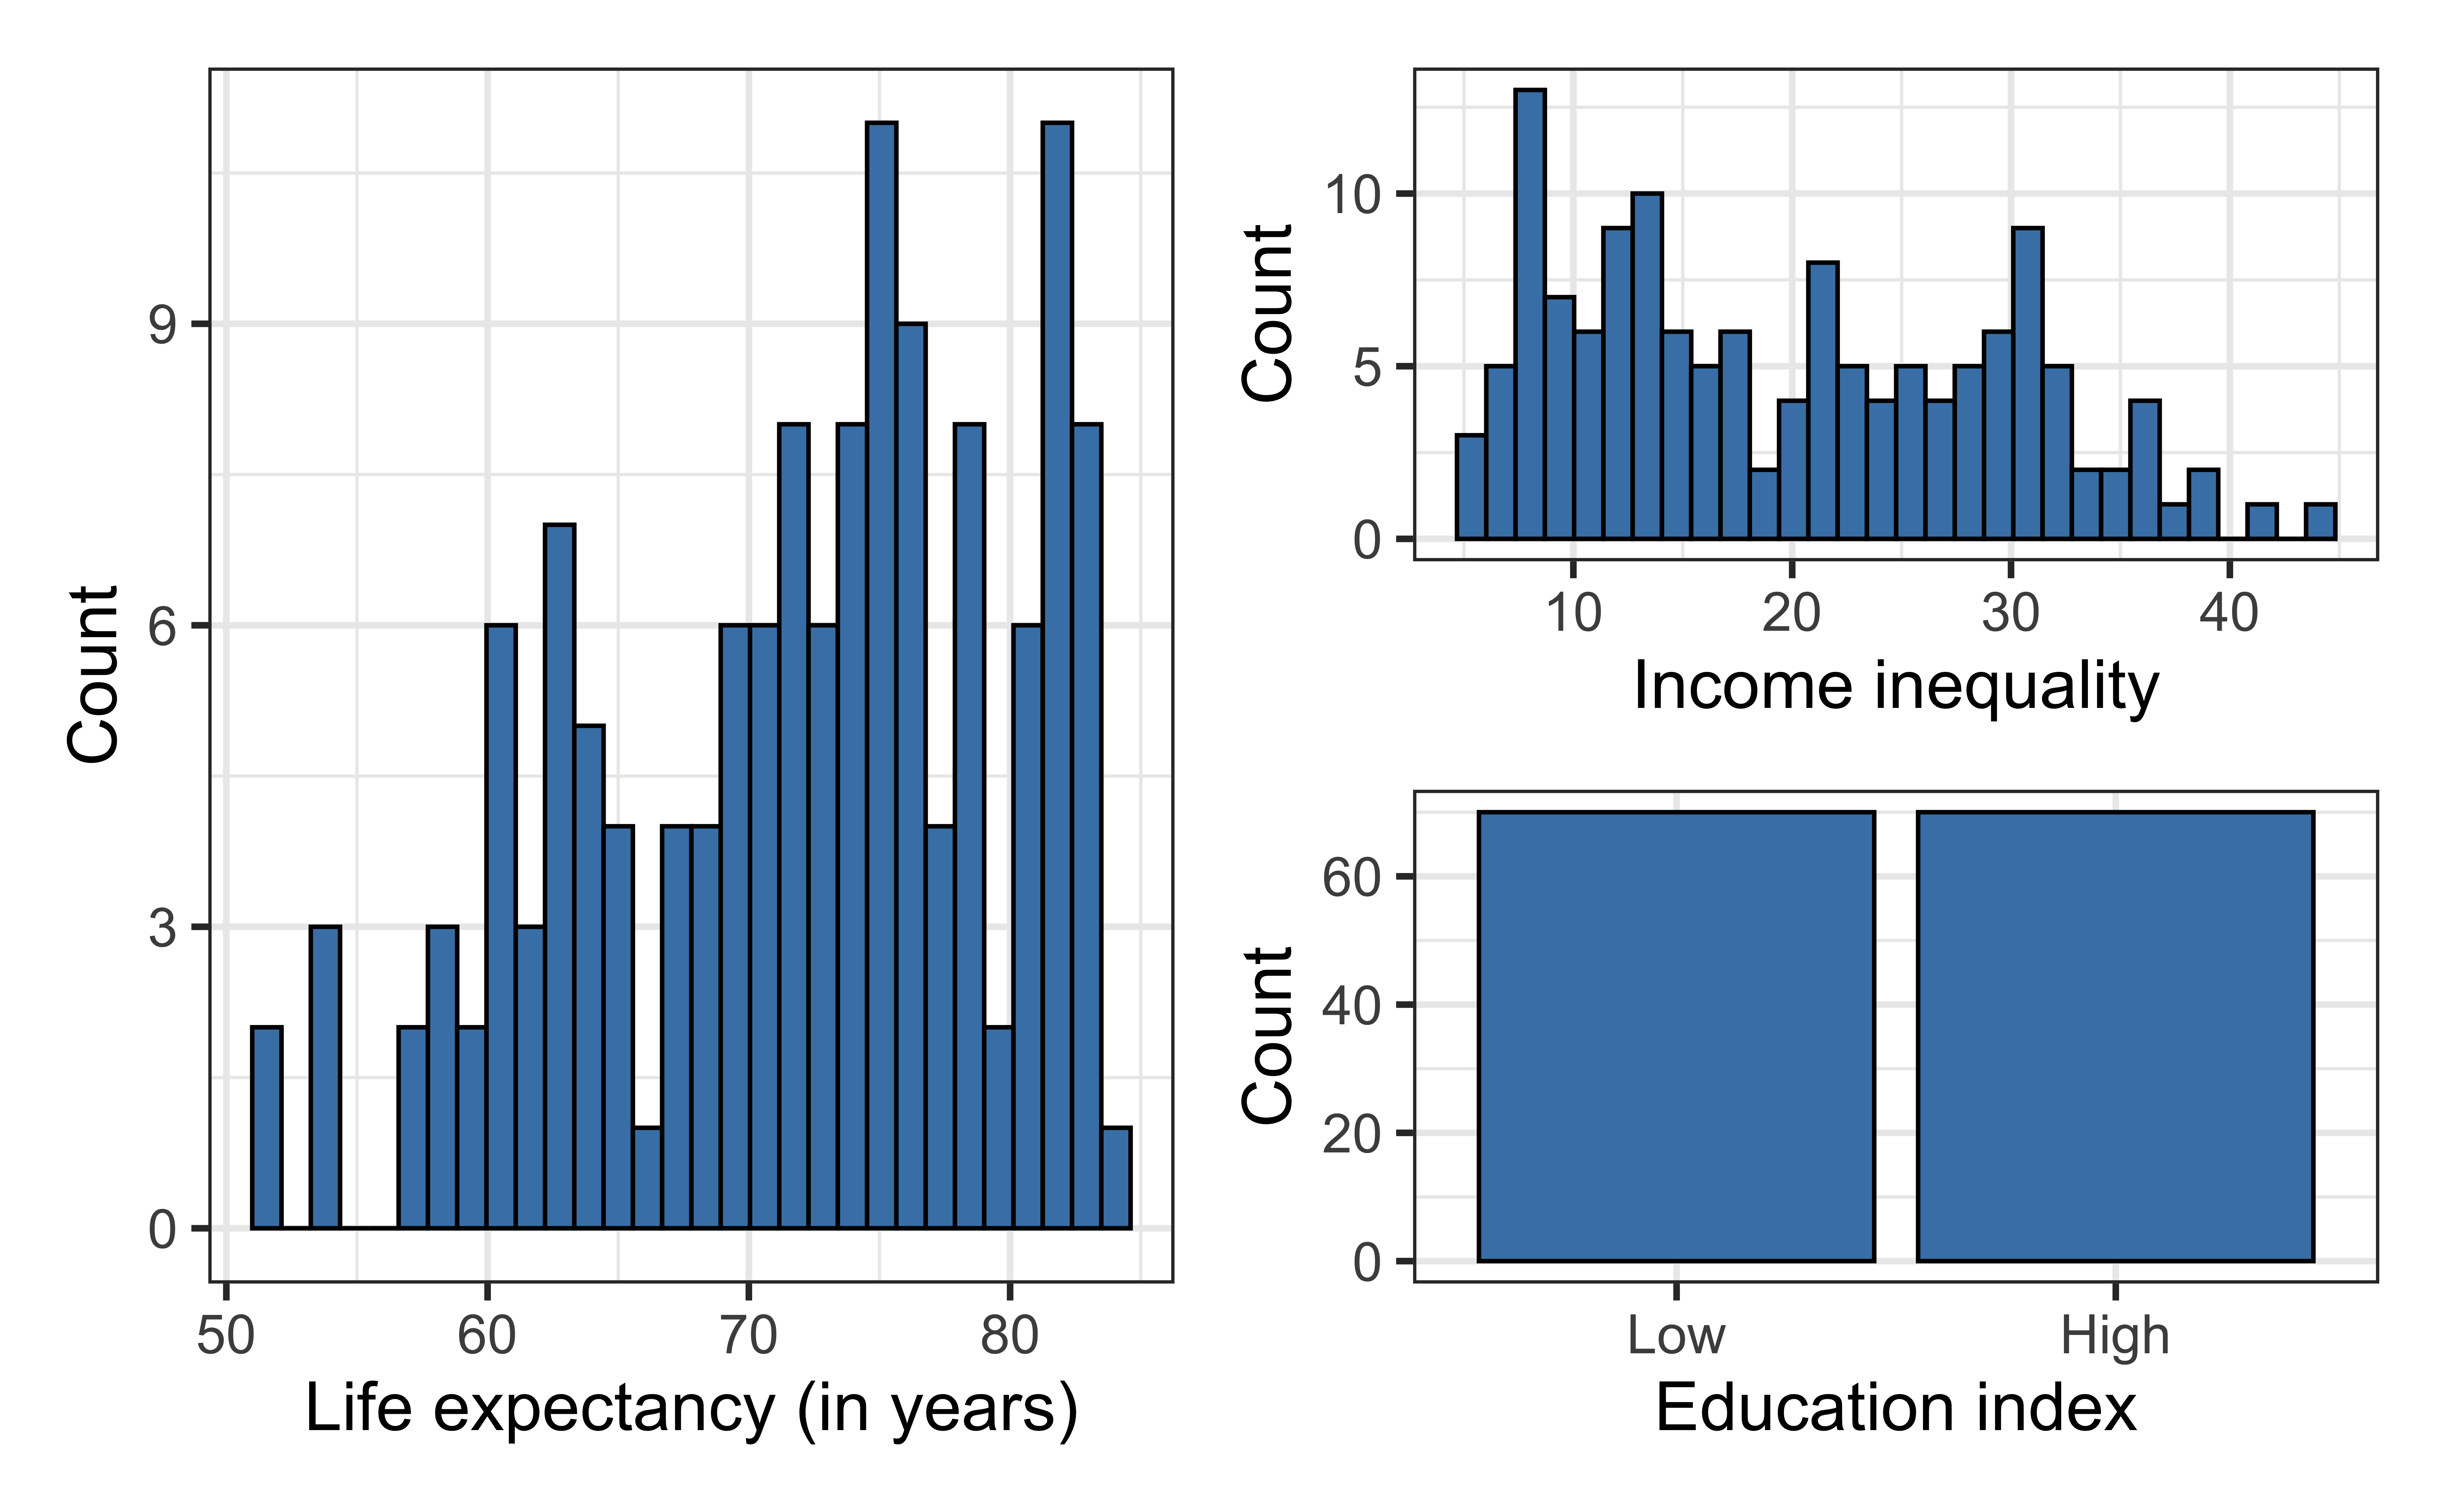
Variable definitions
life_exp: The average number of years that a newborn could expect to live, if he or she were to pass through life exposed to the sex- and age-specific death rates prevailing at the time of his or her birth, for a specific year, in a given country, territory, or geographic area. ( from the World Health Organization)income_inequality: Measure of the deviation of the distribution of income among individuals or households within a country from a perfectly equal distribution. A value of 0 represents absolute equality, a value of 100 absolute inequality (Gini coefficient).
Variable definitions
education: Indicator of whether a country’s education index is above (High) or below (Low) the median index for the 140 countries in the data set.- Education index: Average of mean years of schooling (of adults) and expected years of school (of children), both expressed as an index obtained by scaling wit the corresponding maxima.
Terminology
life_expis the response variable- variable whose variation we want to understand / variable we wish to predict
- also known as outcome or dependent variable
. . .
income_inequality,educationare the predictor variables- variables used to account for variation in the response
- also known as explanatory, independent, or input variables
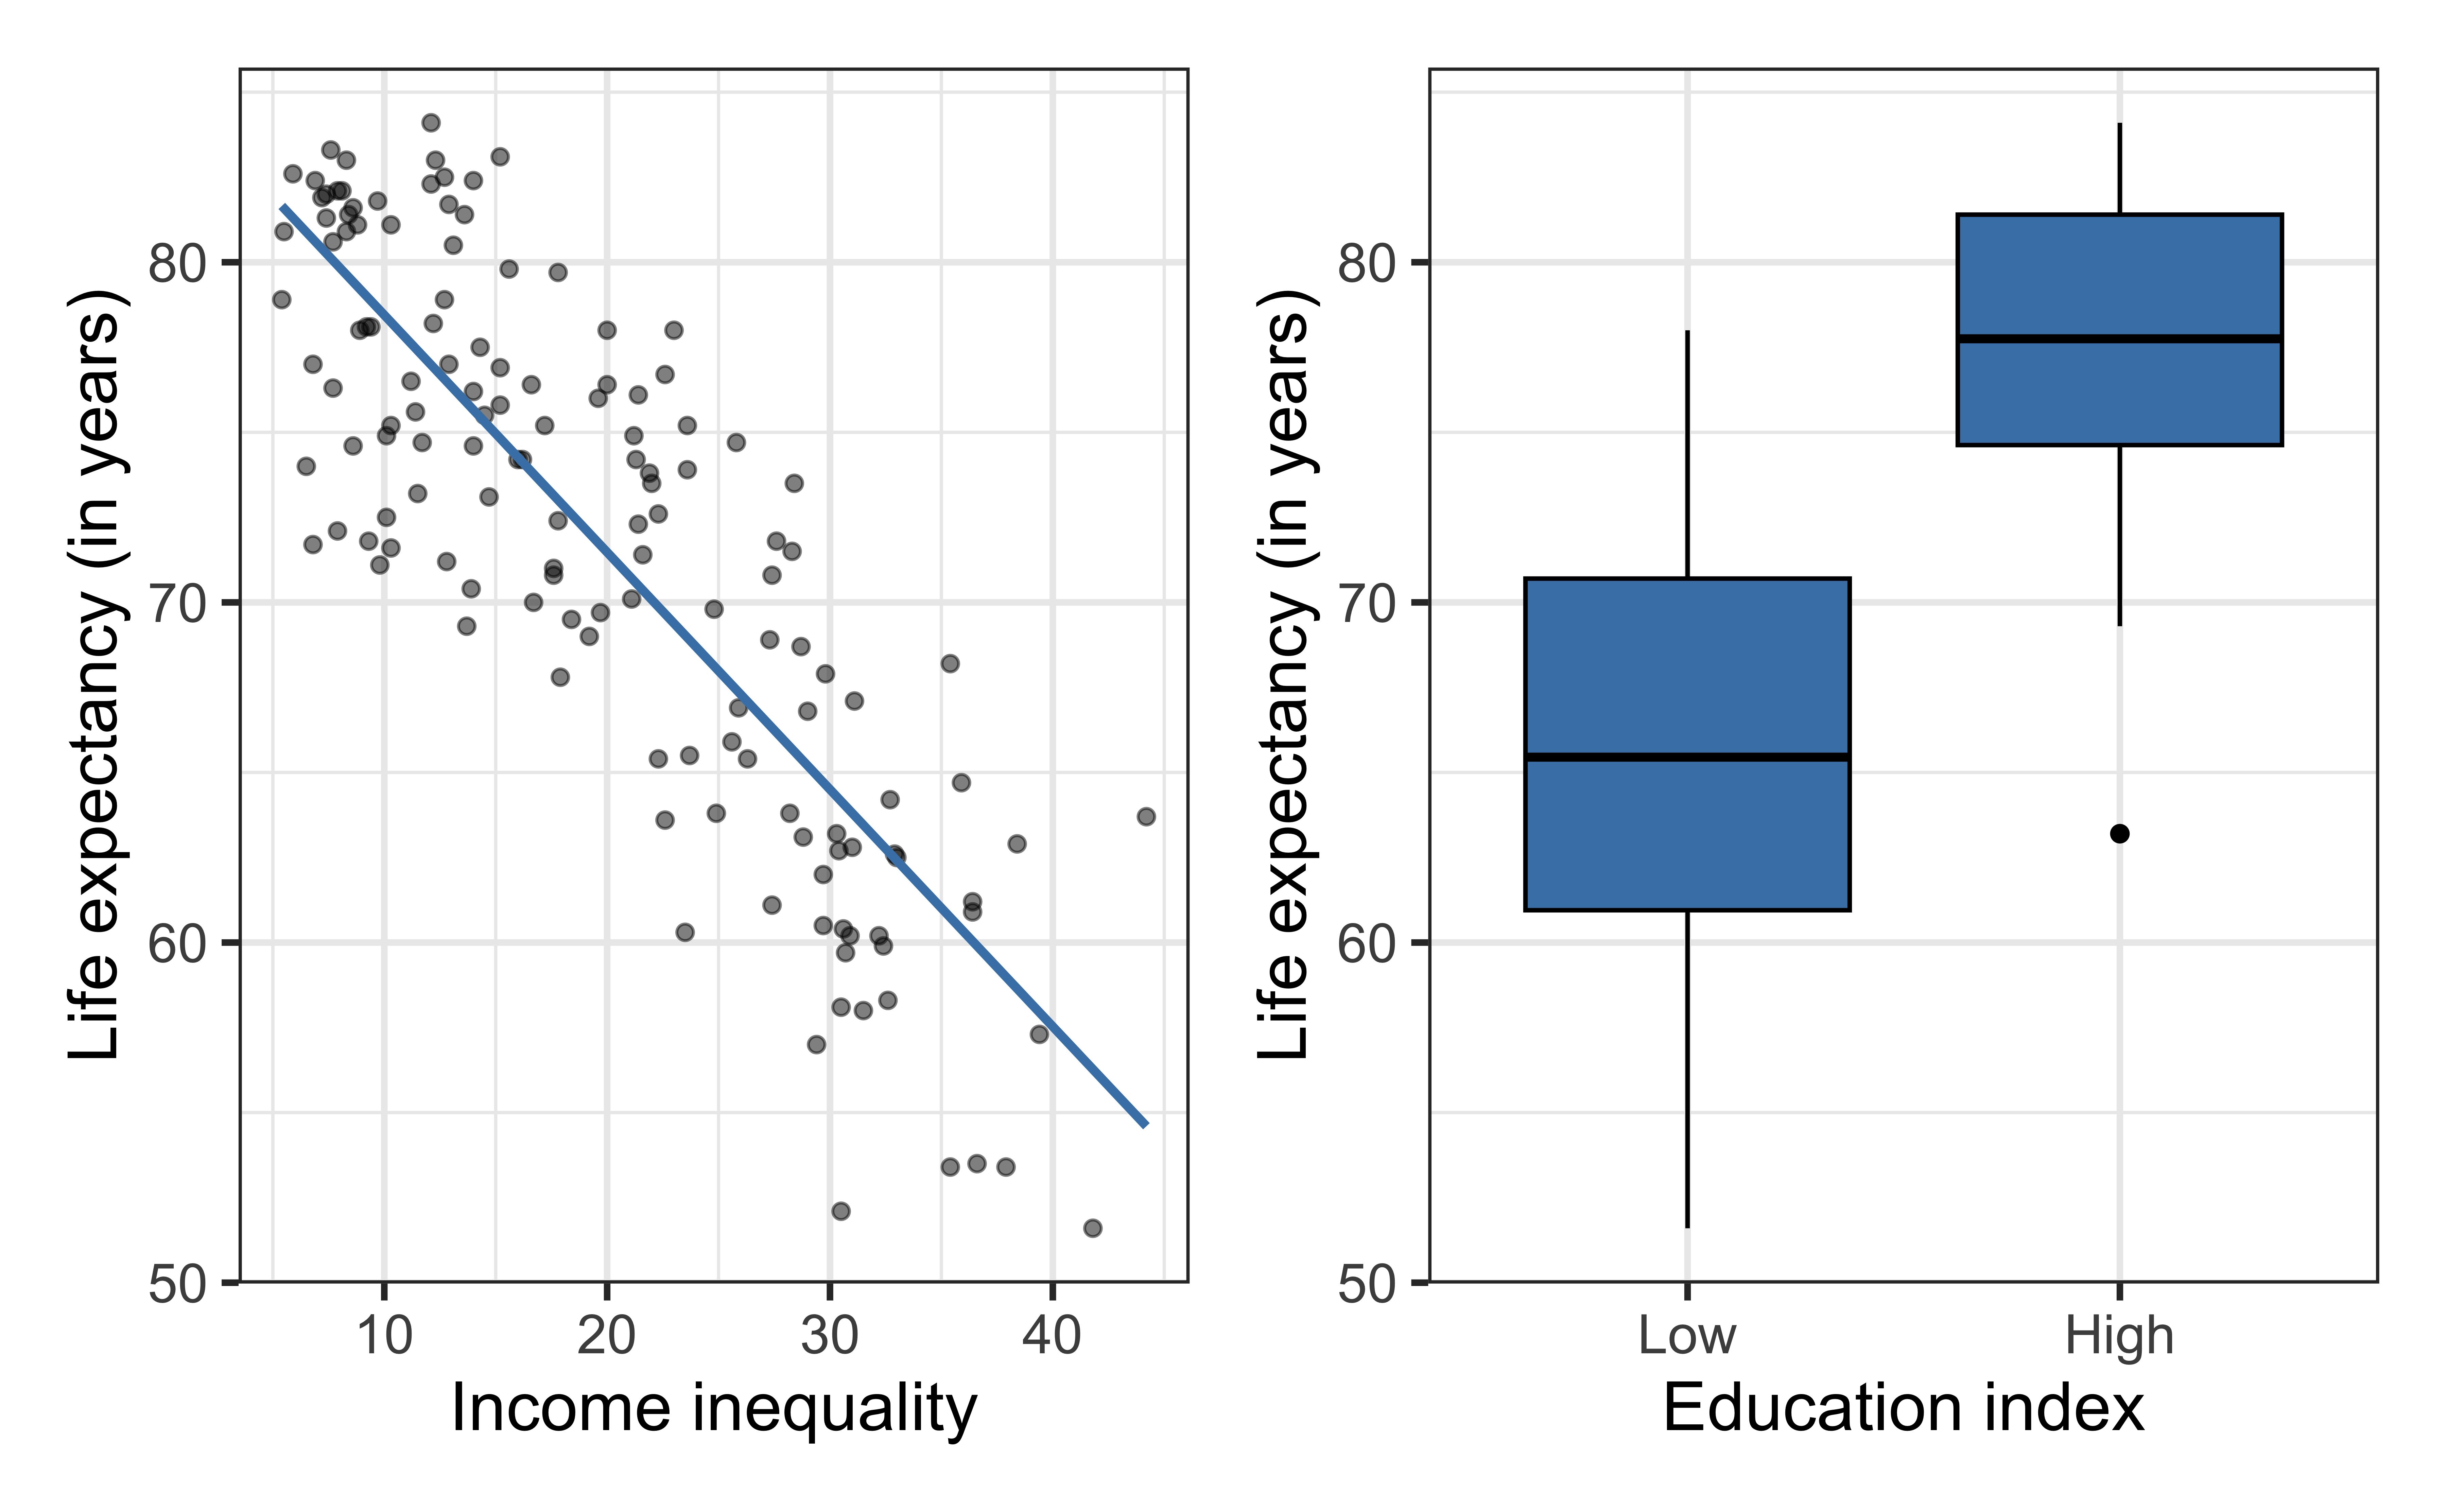
Univariate exploratory data analysis
Bivariate exploratory data analysis
Function between response and predictors
\[\text{life_exp} = f(\text{income_inequality}, \text{education}) + \epsilon\]
- Goal: Determine \(f\)
- How do we determine \(f\)?
- Make an assumption about the functional form \(f\) (parametric model)
- Use the data to fit a model based on that form
Determine \(f\)
- Choose the functional form of \(f\), i.e., choose the appropriate model given the response variable
- Suppose \(f\) takes the form of a linear model
\[y = f(\mathbf{X}) = \beta_0 + \beta_1 x_1 + \dots + \beta_p x_p + \epsilon\]
. . .
- Use the data to fit (or train) the model, i.e, compute estimates of the model parameters, denoted \(\hat{\beta}_0, \hat{\beta}_1, \ldots, \hat{\beta}_p\)
life_exp vs. income_inequality
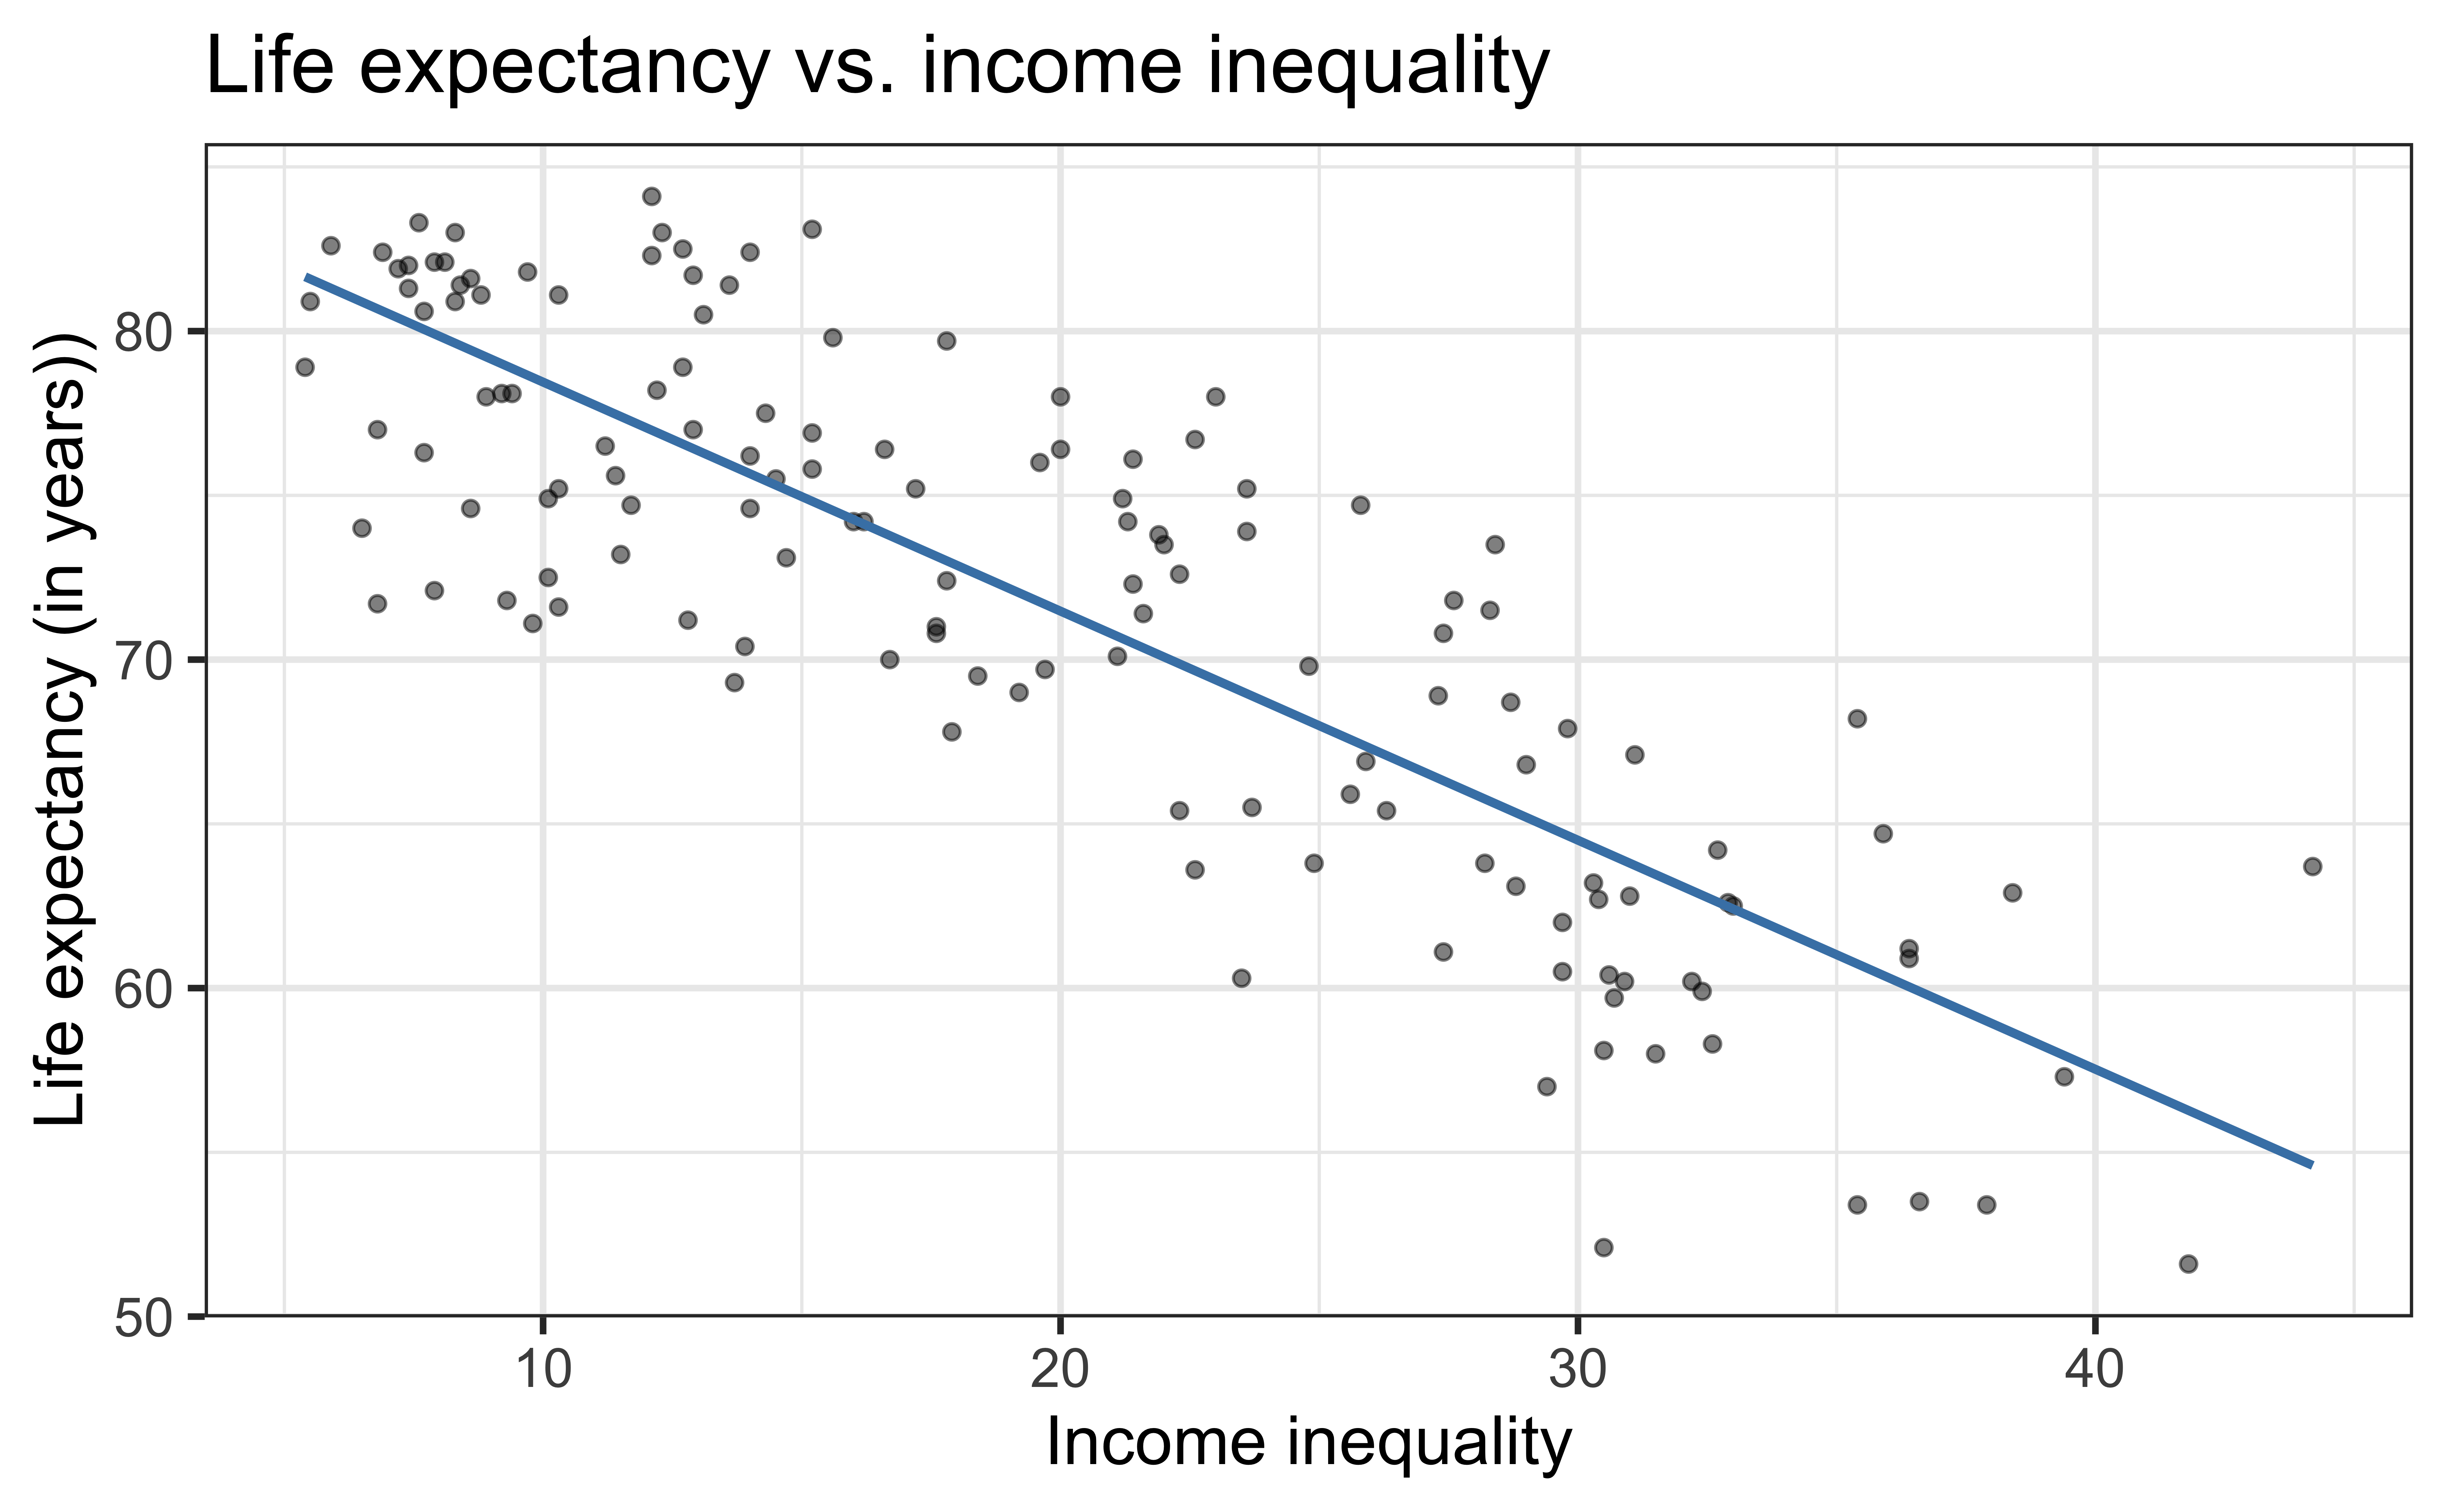
\[\widehat{\text{life_exp}} = \hat{\beta}_0 + \hat{\beta}_1 ~\text{income_inequality}\]
life_exp vs. income_inequality + education
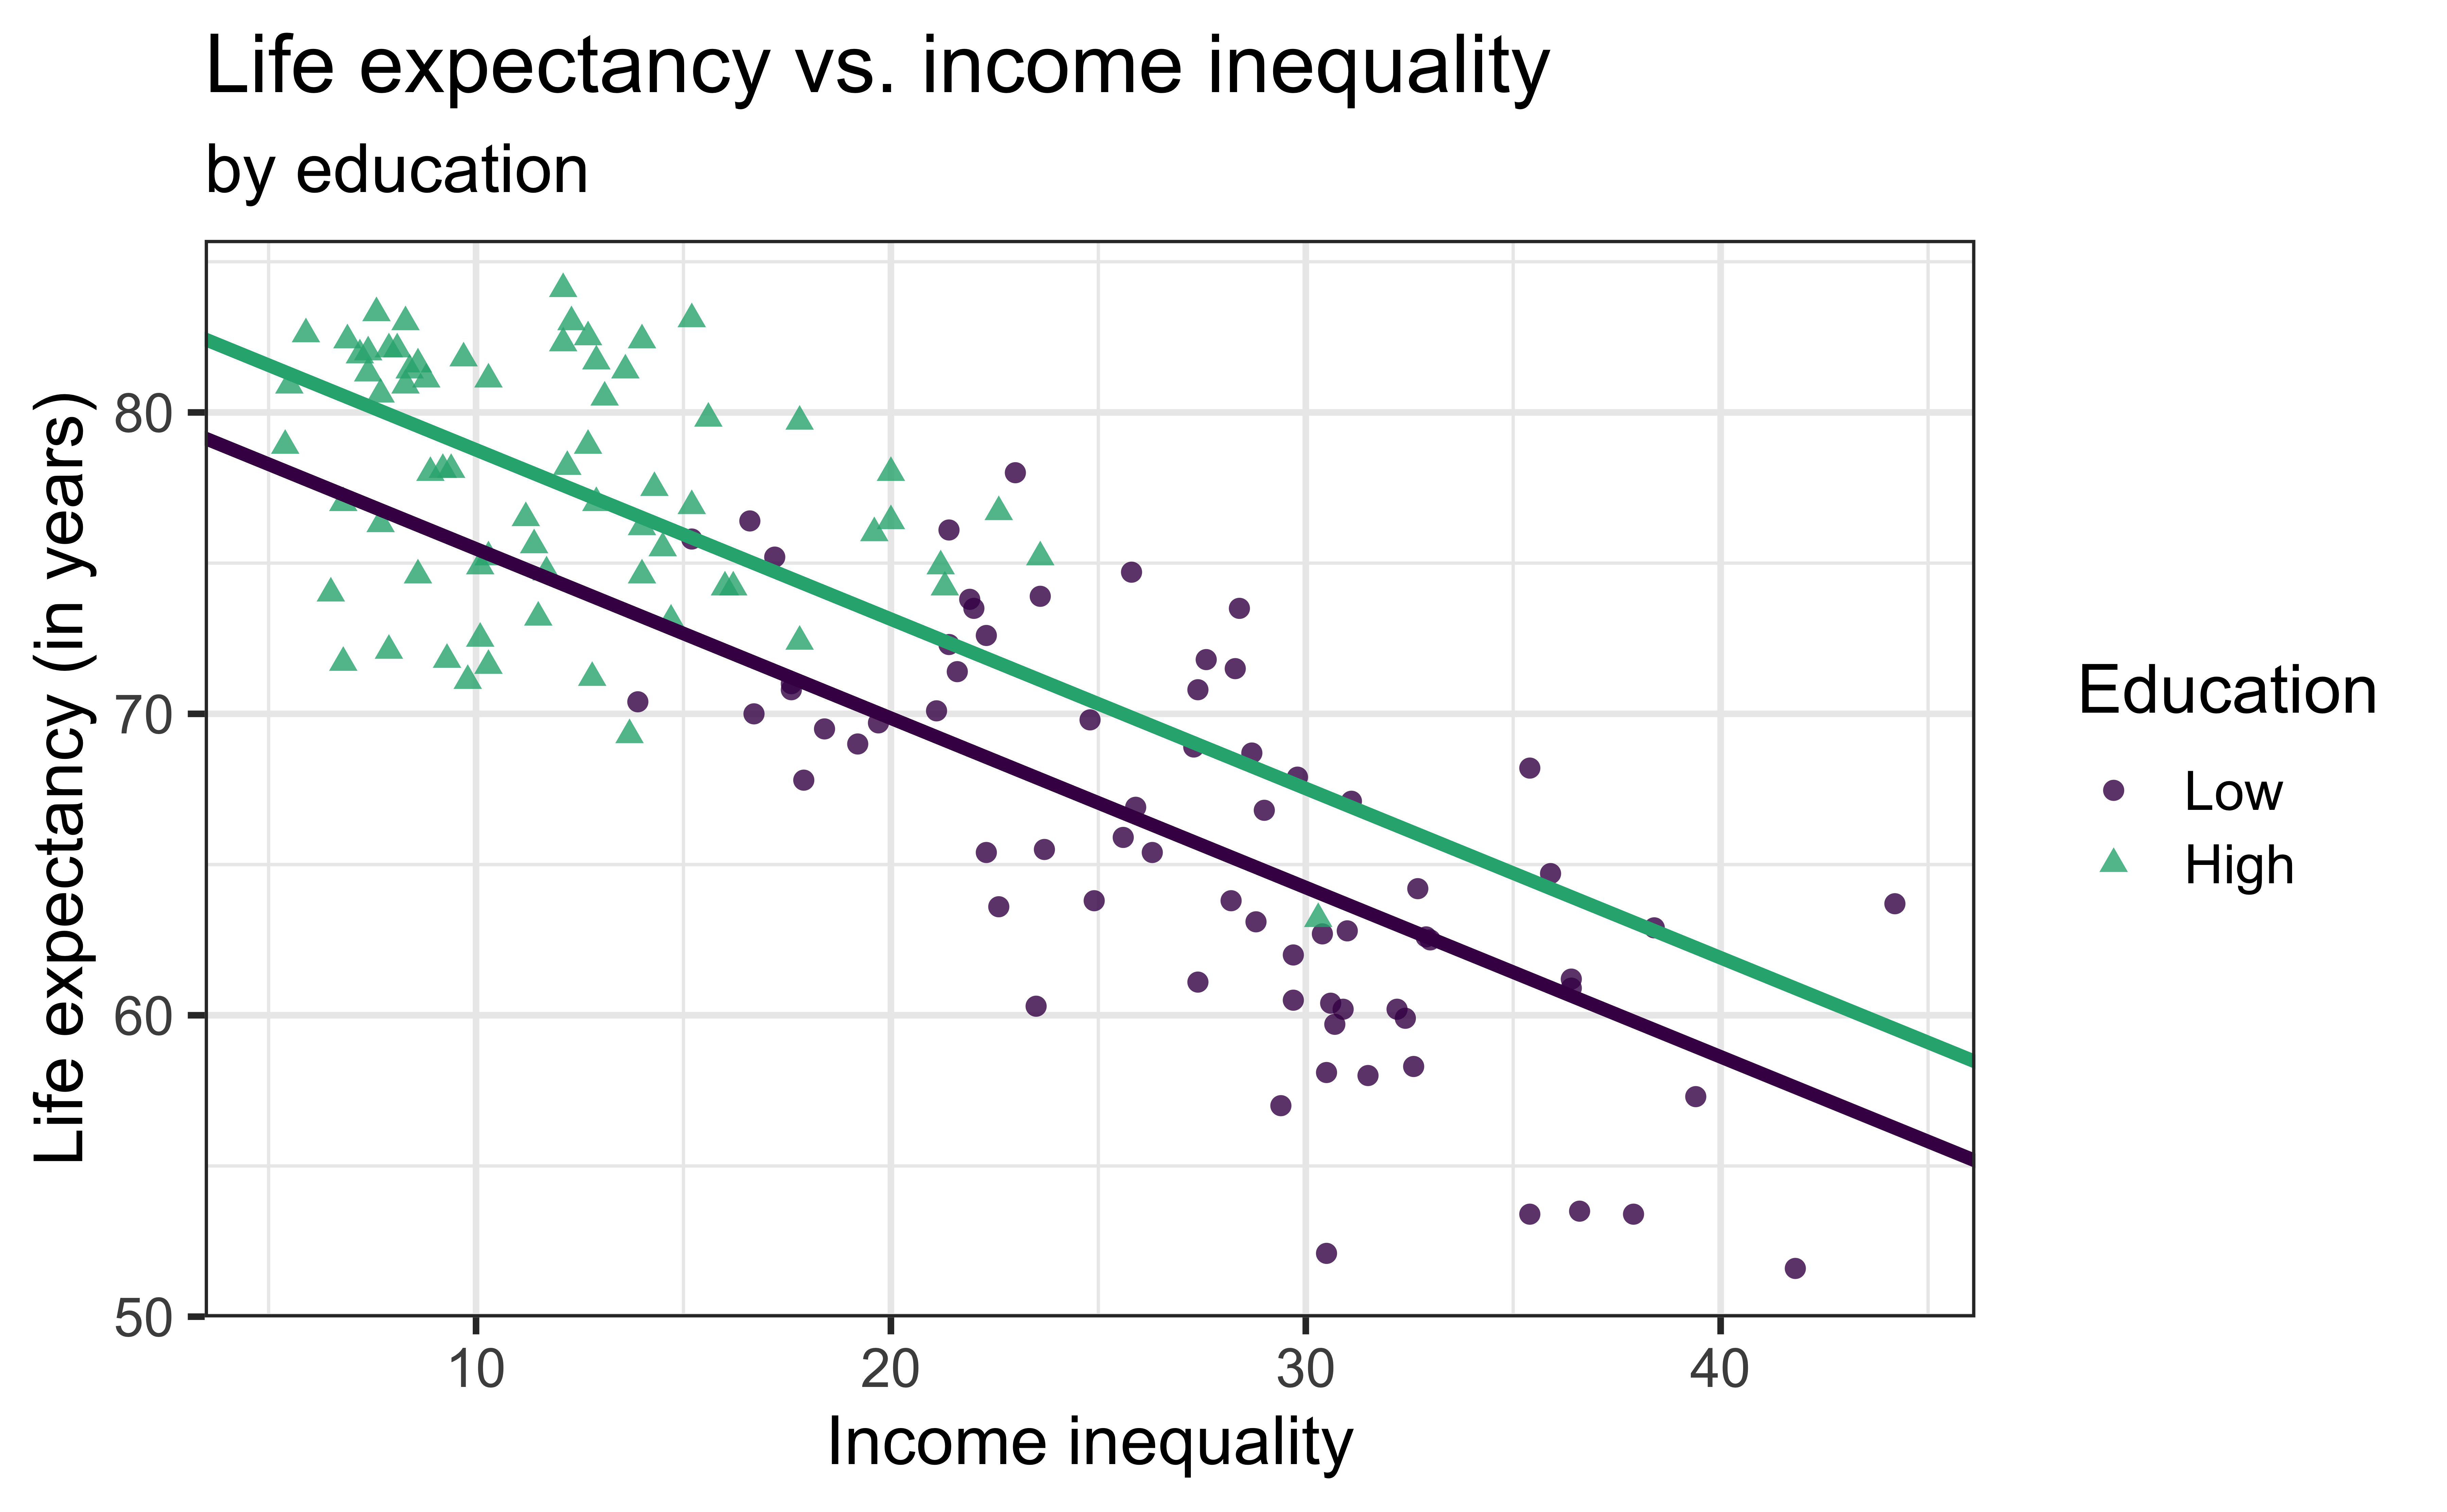
\[\widehat{\text{life_exp}} = \hat{\beta}_0 + \hat{\beta}_1 ~\text{income_inequality} + \hat{\beta}_2 ~\text{education}\]
Statistical model vs. regression equation
Statistical model (also known as the data-generating model)
\[{\small \text{life_exp} = \beta_0 + \beta_1 ~\text{income_inequality} + \beta_2 ~\text{education} + \epsilon}\]
Models the process for generating values of the response in the population (function + error), i.e., the population-level model.
. . .
Regression equation (also known as the fitted model)
Estimate of the function using the sample data
\[{\small \widehat{\text{life_exp}} = \hat{\beta}_0 + \hat{\beta}_1 ~\text{income_inequality} + \hat{\beta}_2 ~\text{education}}\]
life_exp vs. income_inequality + education (with interaction)
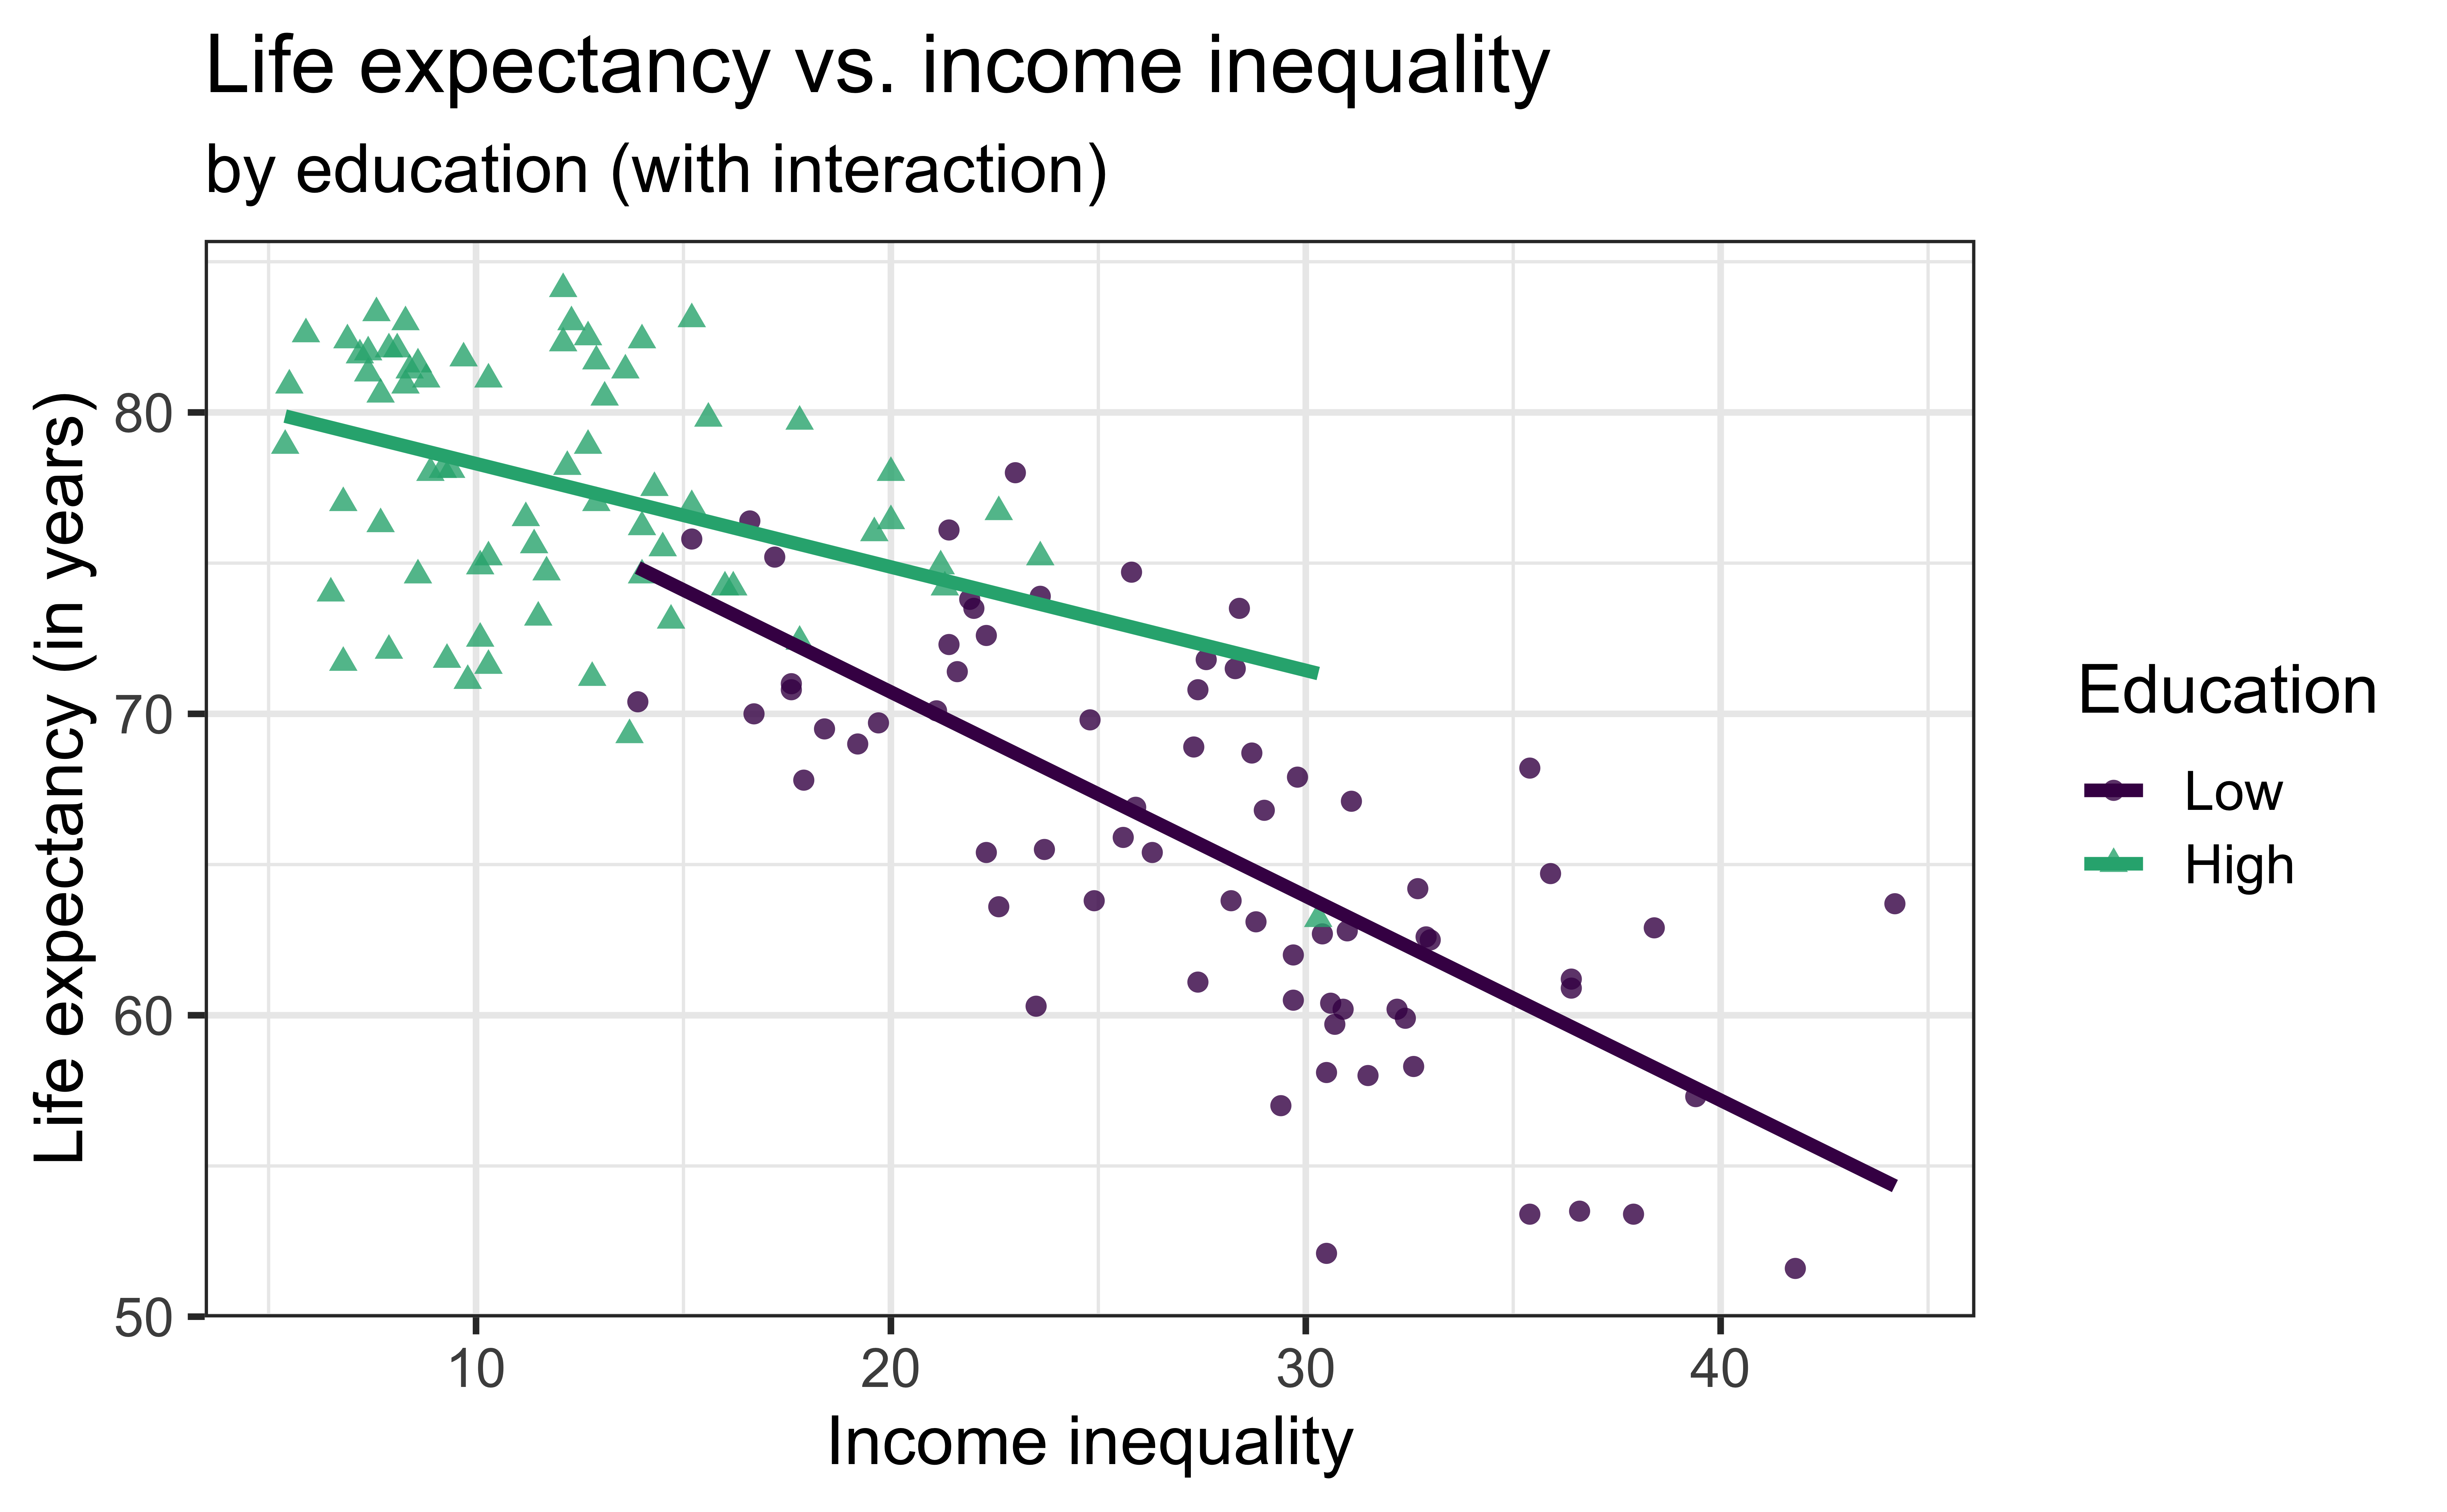
\[{\small \widehat{\text{life_exp}} = \hat{\beta}_0 + \hat{\beta}_1 ~\text{income_inequality} + \hat{\beta}_2 ~\text{education} + \hat{\beta}_3 ~ \text{income_inequality} \times \text{education}}\]
Why fit a model?
Prediction: Expected value of the response variable for given values of the predictor variables
Inference: Conclusion about the relationship between the response and predictor variables
. . .
What is an example of a prediction question that can be answered using the model of
life_expvs.income_inequalityandeducation?What is an example of an inference question that can be answered using the model of
life_expvs.income_inequalityandeducation?
Application exercise
Recap
Reproducibility
It is best practice conduct all data analysis in a reproducible way
We will implement a reproducible workflow using R, Quarto, and git/GitHub
Multivariable relationships
We can use exploratory data analysis to describe the relationship between two variables
We make an assumption about the relationship between variables when doing linear regression
The two main objectives for fitting a linear regression model are (1) prediction and (2) inference
For next time
Bring fully-charged laptop or device with keyboard for in-class application exercise (AE)
References
Alexander, Rohan. 2023. “Telling Stories with Data,” June. https://doi.org/10.1201/9781003229407.
Ostblom, Joel, and Tiffany Timbers. 2022. “Opinionated Practices for Teaching Reproducibility: Motivation, Guided Instruction and Practice.” Journal of Statistics and Data Science Education 30 (3): 241–50. https://doi.org/10.1080/26939169.2022.2074922.
Zarulli, Virginia, Elizaveta Sopina, Veronica Toffolutti, and Adam Lenart. 2021. “Health Care System Efficiency and Life Expectancy: A 140-Country Study.” Edited by Srinivas Goli. PLOS ONE 16 (7): e0253450. https://doi.org/10.1371/journal.pone.0253450.