library(tidyverse)
library(readxl)
library(tidymodels)
library(patchwork)AE 02: Life expectancy and healthcare expenditure
Important
For this AE, you will discuss the questions in groups. This AE does not count towards the Application Exercise grade.
Introduction
The data set comes from Zarulli et al. (2021), who analyze the effects of a country’s healthcare expenditures and other factors on the country’s life expectancy. The data are originally from the Human Development Database and World Health Organization.
This AE will focus on the following variables:
life_exp: The average number of years that a newborn could expect to live, if he or she were to pass through life exposed to the sex- and age-specific death rates prevailing at the time of his or her birth, for a specific year, in a given country, territory, or geographic area. ( from the World Health Organization)health_pct_gdp: Spending on healthcare goods and services, expressed as a percentage of GDP. It excludes capital health expenditures such as buildings, machinery, information technology and stocks of vaccines for emergency or outbreaks.
Click here for the original research paper and a full list of variables in the original data set.
life_exp <- read_excel("data/life-expectancy-data.xlsx") |>
  rename(life_exp = `Life_expectancy_at_birth`,
         health_pct_gdp = `Domestic_general_government_health_expenditure_pct_of_GDP`)
life_exp |>
select(life_exp, health_pct_gdp) |>
glimpse()Rows: 140
Columns: 2
$ life_exp <dbl> 63.8, 78.2, 59.9, 76.2, 74.6, 83.0, 81.3, 72.5, 71.8, 7…
$ health_pct_gdp <dbl> 5, 41, 44, 74, 16, 68, 73, 20, 18, 61, 84, 66, 21, 74, …Exercises
We begin by visualizing the distributions of life expectancy, health expenditure percentage, and the relationship between these two variables.
p1 <- ggplot(life_exp, aes(x = life_exp)) +
  geom_histogram() +
  labs(x = "Life expectancy")

p2 <- ggplot(life_exp, aes(x = health_pct_gdp)) +
  geom_histogram() +
  labs(x = "% Health expenditure")

p3 <- ggplot(life_exp, aes(x = health_pct_gdp, y = life_exp)) +
  geom_point() +
  labs(x = "% Health expenditure",
       y = "Life expectancy")

(p1 | p2) / p3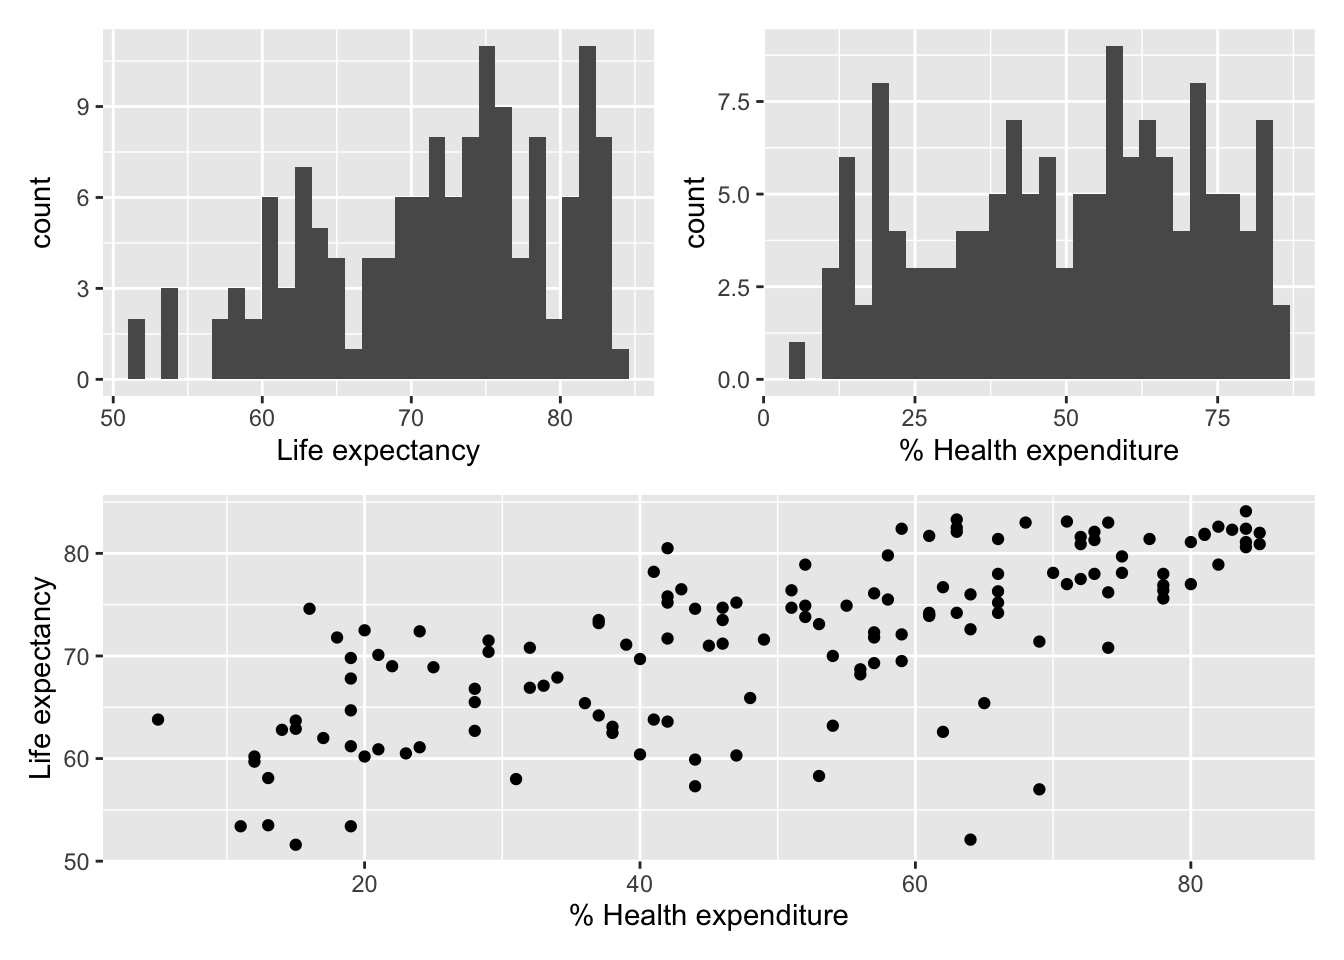
Exercise 1
Describe the relationship between life expectancy and healthcare expenditure as a percentage of the GDP. Comment on how we expect the life expectancy to change as the percentage on healthcare expenditure changes.
Exercise 2
Suppose you want to fit a model so you can use the healthcare expenditure as a percentage of GDP to predict life expectancy. Would a model of the form
\[\text{life_exp} = \beta_0 + \beta_1 ~ \text{health_pct_gdp} + \epsilon\]
be a useful model for the data? Why or why not?
References
Zarulli, Virginia, Elizaveta Sopina, Veronica Toffolutti, and Adam Lenart. 2021. “Health Care System Efficiency and Life Expectancy: A 140-Country Study.” Edited by Srinivas Goli. PLOS ONE 16 (7): e0253450. https://doi.org/10.1371/journal.pone.0253450.