library(tidyverse)
library(tidymodels)
library(knitr)Lab 05: Logistic Regression
Due date
This lab is due on Thursday, March at 27 11:59pm. To be considered on time, the following must be done by the due date:
- Final
.qmdand.pdffiles pushed to your team’s GitHub repo - Final
.pdffile submitted on Gradescope
Logistic Regression
In this lab, you will use logistic regression analysis to classify rice varieties based on features derived from image data. You will fit and interpret the logistic regression models using training data, then use testing data to assess how well the model classifies observations into the two varieties.
Learning goals
By the end of the lab you will be able to…
conduct exploratory data analysis for data with a binary response variable.
fit and interpret logistic regression model.
use relevant metrics and subject-matter context to identify a threshold for classification.
use training and testing data to fit and assess model performance.
Develop strategies for dealing with merge conflicts
Merge Conflicts (uh oh)
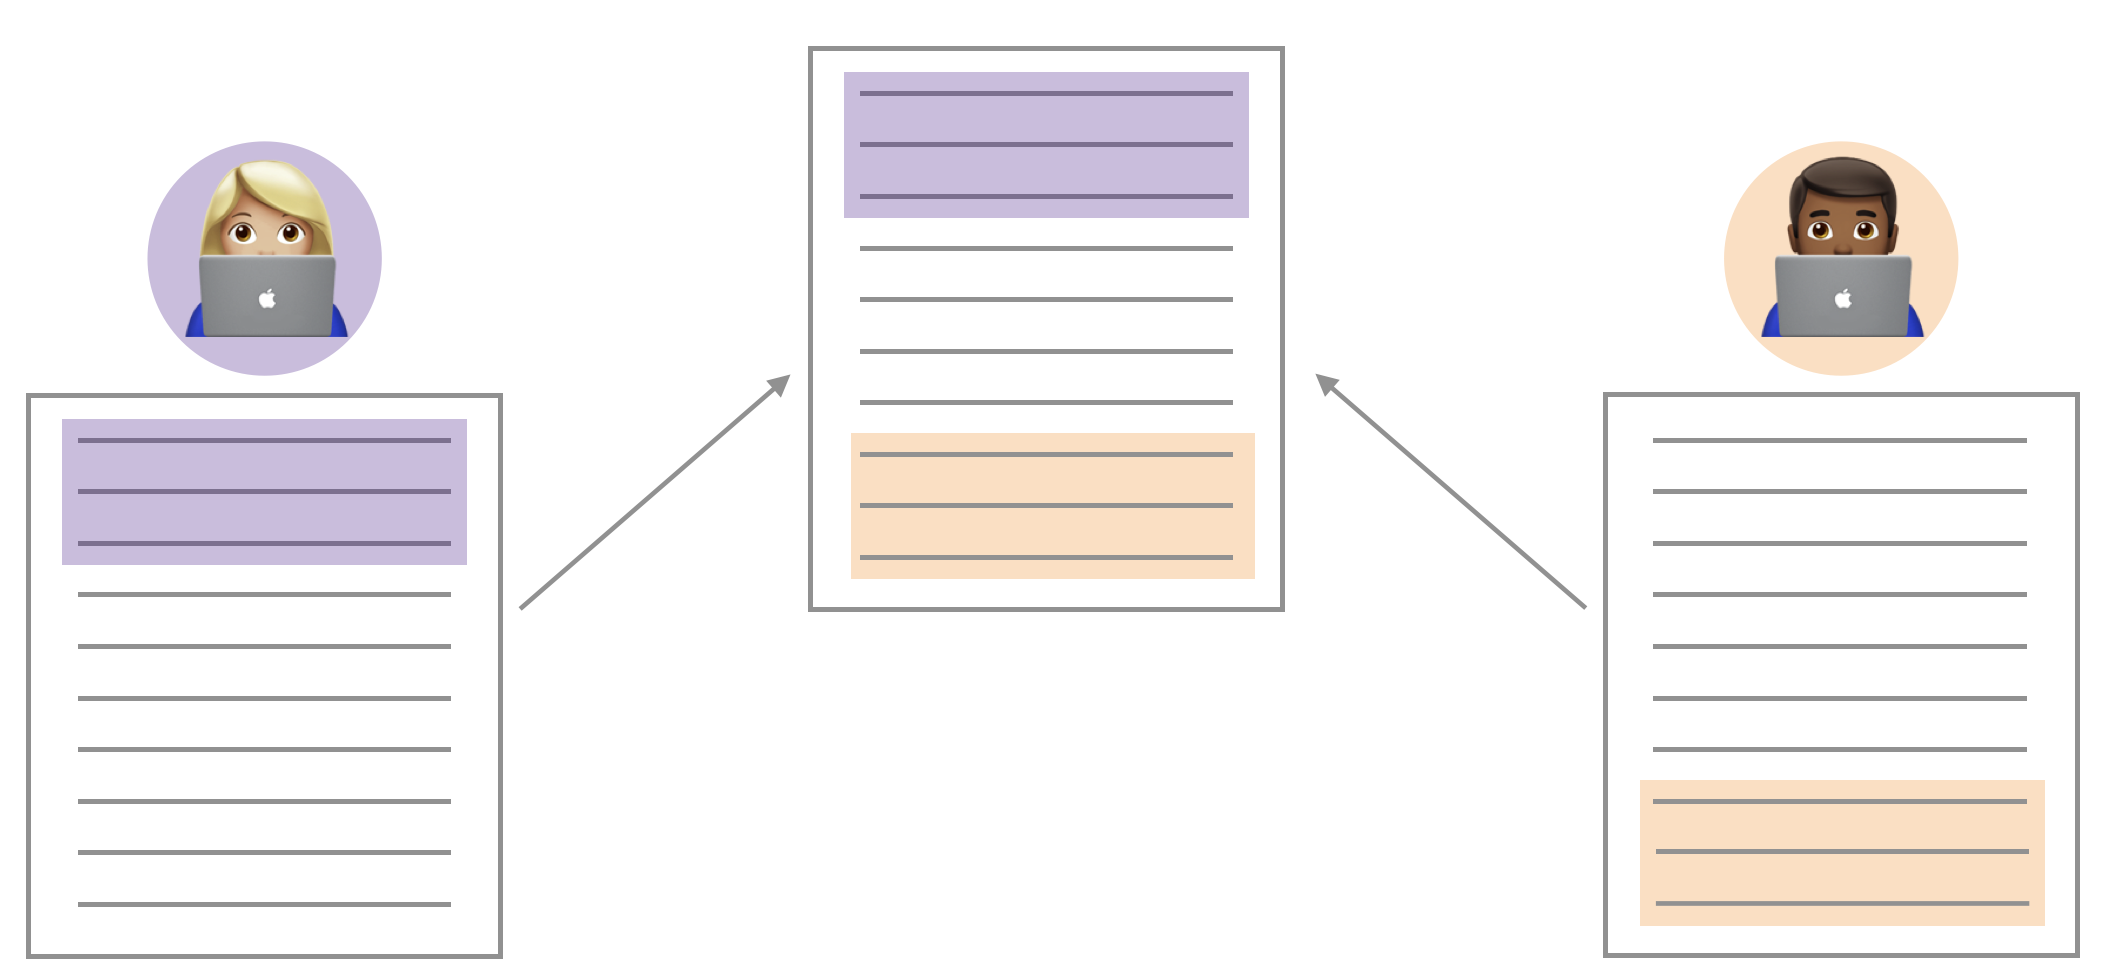
You may have seen something like the image above through the course of your collaboration. When two collaborators make changes to a file and push the file to their repository, git merges these two files.
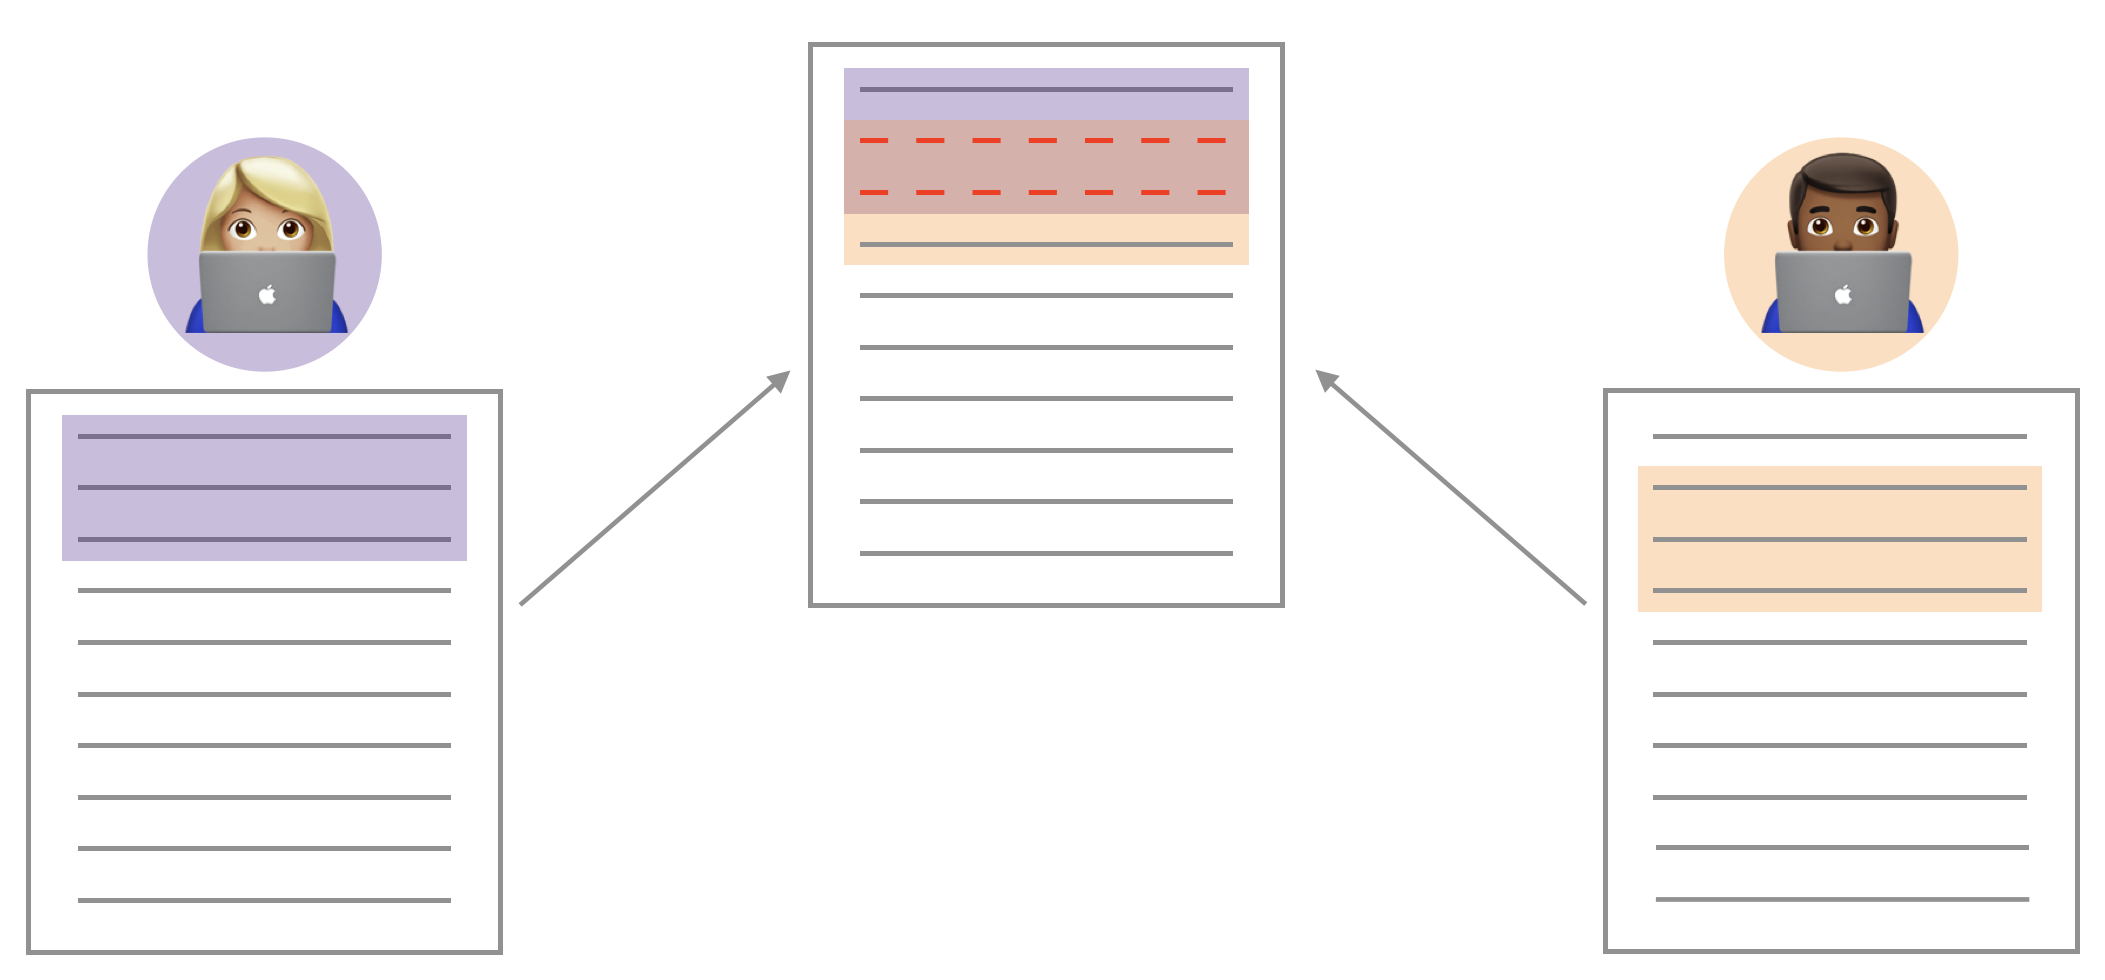
If these two files have conflicting content on the same line, git will produce a merge conflict. Merge conflicts need to be resolved manually, as they require a human intervention:
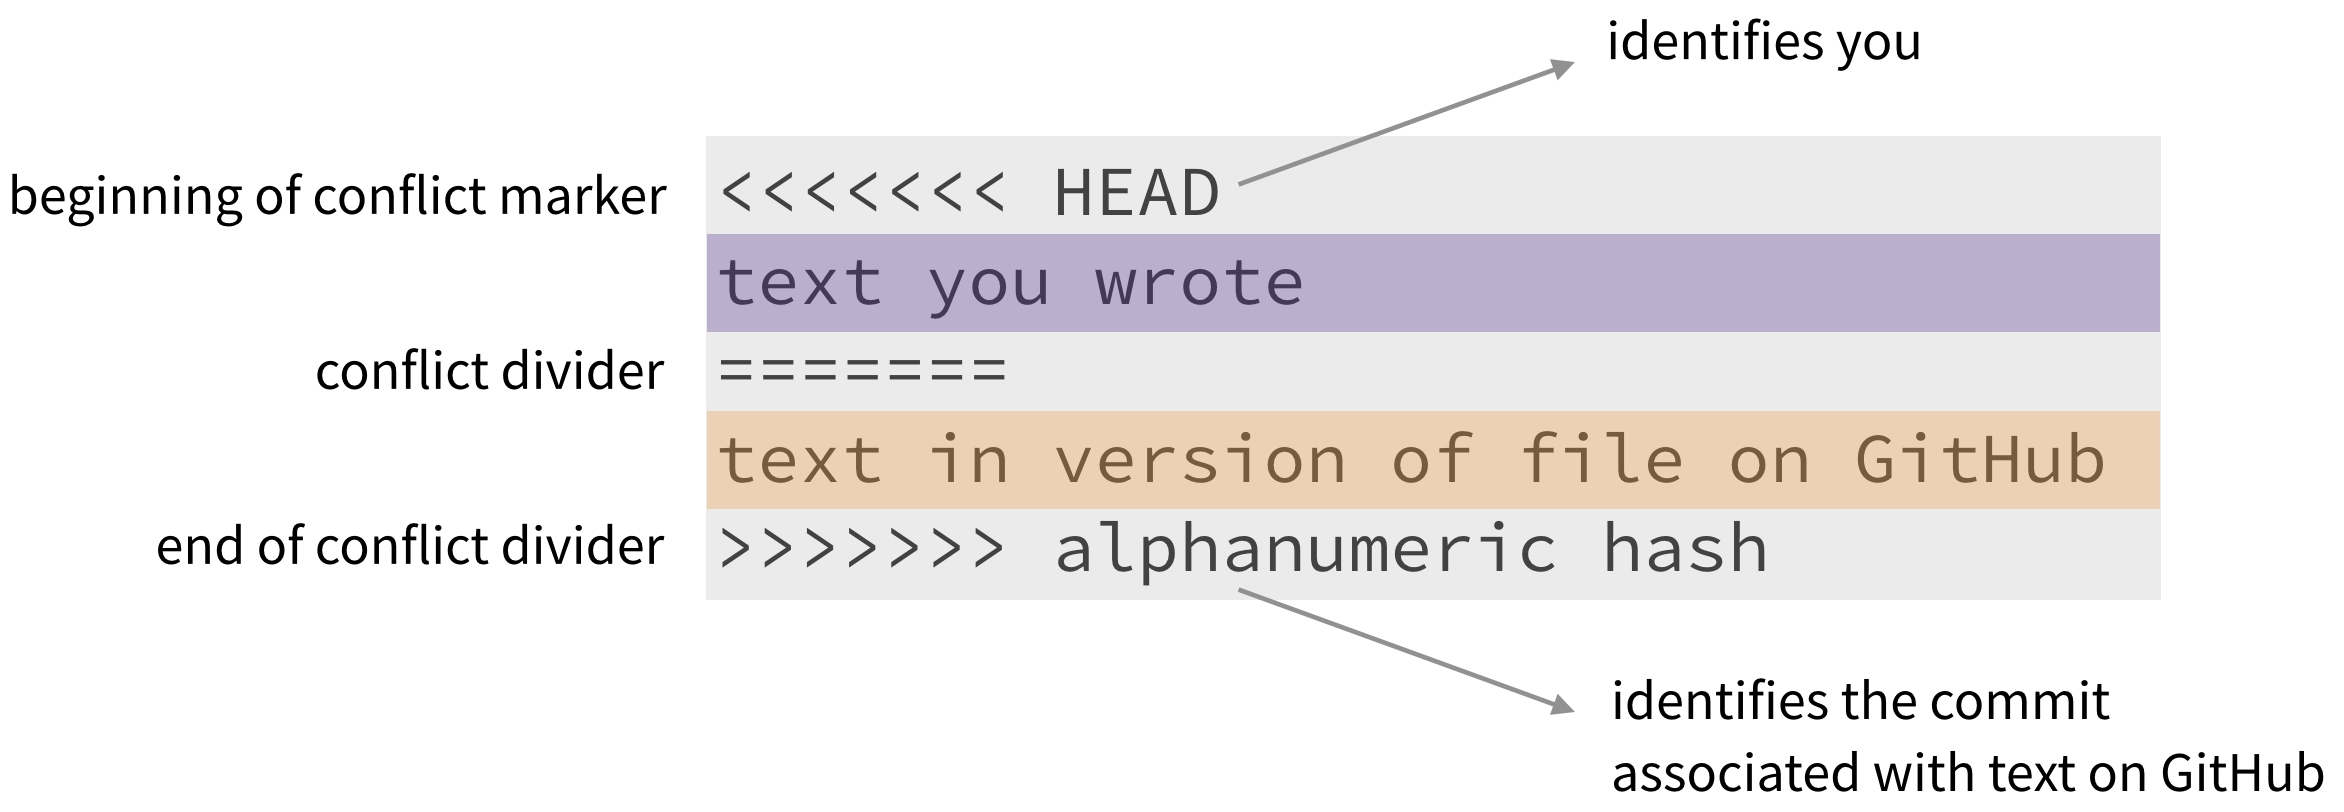
To resolve the merge conflict, decide if you want to keep only your text, the text on GitHub, or incorporate changes from both texts. Delete the conflict markers <<<<<<<, =======, >>>>>>> and make the changes you want in the final merge.
Assign numbers 1, 2, 3, and 4 to each of your team members (if only 3 team members, just number 1 through 3). Go through the following steps in detail, which simulate a merge conflict. Completing this exercise will be part of the lab grade.
Resolving a merge conflict
Step 1: Everyone clone the merge-conflict assignment repo in RStudio and open file merge-conflict.qmd.
Member 4 should look at the group’s repo on GitHub.com to ensure that the other members’ files are pushed to GitHub after every step.
Step 2: Member 1 Change the team name to your team name. Render, commit, and push.
Step 3: Member 2 Change the team name to something different (i.e., not your team name). Render, commit, and push.
You should get an error.
Pull and review the document with the merge conflict. Read the error to your teammates. You can also show them the error by sharing your screen. A merge conflict occurred because you edited the same part of the document as Member 1. Resolve the conflict with whichever name you want to keep, then render, commit and push again.
Step 4: Member 3 Write some narrative in the space provided. You should get an error.
This time, no merge conflicts should occur, since you edited a different part of the document from Members 1 and 2. Read the error to your teammates. You can also show them the error by sharing your screen.
Click to pull. Then render, commit, and push.
You have successfully completed the merge conflict activity! There is nothing to submit on Gradescope for this activity. Please ask your TA if you have any questions about merge conflicts and collaborating in GitHub.
Getting started
A repository has already been created for you and your teammates. Everyone in your team has access to the same repo.
Go to the sta210-sp25 organization on GitHub. Click on the repo with the prefix lab-05. It contains the starter documents you need to complete the lab.
Clone the repo and start a new project in RStudio. See the Lab 00 instructions for details on cloning a repo and starting a new project in R.
Each person on the team should clone the repository and open a new project in RStudio. Throughout the lab, each person should get a chance to make commits and push to the repo.
Workflow: Using Git and GitHub as a team
Important
There are no Team Member markers in this lab; however, you should use a similar workflow as in Lab 03. Only one person should type in the group’s .qmd file at a time to avoid merge conflicts. Once that person has finished typing the group’s responses, they should render, commit, and push the changes to GitHub. All other teammates can pull to see the updates in RStudio.
Every teammate must have at least one commit in the lab. Everyone is expected to contribute to discussion even when they are not typing.Packages
You will use the following packages in today’s lab. Add other packages as needed.
Data
The data in this lab contains measures describing the shape and structure of two rice varieties - Cammeo and Osmancik. To curate the data set, researchers used images from over 3,000 grains a rice in these two varieties. They then used automated methods to process the image data and extract 7 morphological features (features related to the structure) from each image. The data were originally presented and analyzed in Cinar and Koklu (2019) and was obtained from the UCI Machine Learning Repository.
This analysis will focus on the following variables:
Class: Cammeo or OsmancikArea: Size of the rice grain measured in pixelsEccentricity: A measure of how round the ellipse is, i.e., how close the shape of the grain is to a circle.
Click here for the full data dictionary.
rice <- read_csv("data/rice.csv")Exercises
Goal: The goal of the analysis is to use Area and Eccentricity to identify grains from the Cammeo variety versus those from the Osmancik variety.
Exercise 1
Create a scatterplot of Area versus Eccentricity, such that the color and shape of the points are based on Class.
Exercise 2
Based on the plot from the previous exercise, do you think the two rice types can be distinguished based on Area and Eccentricity. Briefly explain.
Exercise 3
Split the data into training (75%) and testing sets (25%). Use a seed of 210 for reproducibility.
Exercise 4
In a logistic regression model, the log-odds of the response being “1” (a “success”) is given by \[\log\Big(\frac{p_i}{1-p_i}\Big) = \beta_0 + \beta_1X_1 + \dots + \beta_pX_p\]
In this analysis, a “success” means the Class is “Osmancik”.
What does each \(p_i\) represent in the context of this analysis?
How is the probability of the response variable being “1” calculated from the log-odds? Show or explain the mathematical steps to go from the log-odds to the probability.
Exercise 5
Use the training data to fit the logistic regression model for the response variable
Classusing the predictorsAreaandEccentricity. Neatly display the output using 3 decimal places.Does the intercept have any meaningful interpretation? If so, interpret the intercept. If not, explain why.
Exercise 6
Interpret the coefficients on Area and Eccentricity in the context of the data in terms of the odds.
Exercise 7
How would you expect the log-odds of the rice grain being of the Osmancik variety to change if the eccentricity changes from 0.85 to 0.9?
How would you expect the odds of the rice grain being of the Osmancik variety to change if the eccentricity changes from 0.85 to 0.9?
Exercise 8
Now let’s evaluate our model on the test set. Use the predict() function to obtain the predicted probabilities of the rice being Osmancik for the observations in the testing data.
Exercise 9
With these estimated probabilities, we can now try to classify the rice in the test set. Choose a threshold for assigning a class to each observation based on the estimated probability. Briefly explain your reasoning for selecting the threshold, including any analysis used to make your decision (if applicable).
Exercise 10
Compare the estimated class assignments based on the threshold from the previous exericse with the actual classes. Comment on the result and the model’s performance.
Submission
Submit your completed assignment as a PDF to Gradescope. Follow the instructions carefully to ensure your submission is complete.
Warning
Before you wrap up the assignment, make sure all documents are updated on your GitHub repo. We will be checking these to make sure you have been practicing how to commit and push changes.
Remember – you must turn in a PDF file to the Gradescope page before the submission deadline for full credit.
To submit your assignment:
Access Gradescope through the STA 210 Canvas site.
Click on the assignment, and you’ll be prompted to submit it.
Select all team members’ names, so they receive credit on the assignment. Click here for video on adding team members to assignment on Gradescope.
Mark the pages associated with each exercise. All of the pages of your lab should be associated with at least one question (i.e., should be “checked”).
Select the first page of your .PDF submission to be associated with the “Workflow & formatting” section.
Grading
| Component | Points |
|---|---|
| Ex 1 | 3 |
| Ex 2 | 4 |
| Ex 3 | 3 |
| Ex 4 | 5 |
| Ex 5 | 4 |
| Ex 6 | 6 |
| Ex 7 | 6 |
| Ex 8 | 2 |
| Ex 9 | 4 |
| Ex 10 | 4 |
| Workflow & formatting | 4 |
| Merge conflict activity | 5 |
The “Workflow & formatting” grade is to assess the reproducible workflow and collaboration. This includes having at least one meaningful commit from each team member, a neatly organized document with readable code, and updating the team name and date in the YAML.
References
Cinar, Ilkay, and Murat Koklu. 2019. “Classification of Rice Varieties Using Artificial Intelligence Methods.” International Journal of Intelligent Systems and Applications in Engineering 7 (3): 188–94.