library(tidyverse)
library(tidymodels)
library(openintro)
library(knitr)AE 05: Permutation test for the slope
Houses in Duke Forest
Important
Go to the course GitHub organization and locate your ae-05 repo to get started.
Render, commit, and push your responses to GitHub by the end of class.
Data
The data are on houses that were sold in the Duke Forest neighborhood of Durham, NC around November 2020. It was originally scraped from Zillow, and can be found in the duke_forest data set in the openintro R package.
Goal: Use statistical inference to evaluate whether there is a relationship between the age of the house at time of sale and its price.
Exploratory data analysis
Let’s begin by creating a new variable that is the age of the house in 2020.
duke_forest <- duke_forest |>
  mutate(age_2020 = 2020 - year_built)
Now let’s visualize the relationship between the age of the house in 2020 and the sales price.
ggplot(duke_forest, aes(x = age_2020, y = price)) +
  geom_point(alpha = 0.7) +
  labs(
    x = "Age in 2020 (years)",
    y = "Sale price (USD)",
    title = "Price and age of houses in Duke Forest"
  ) +
scale_y_continuous(labels = label_dollar()) 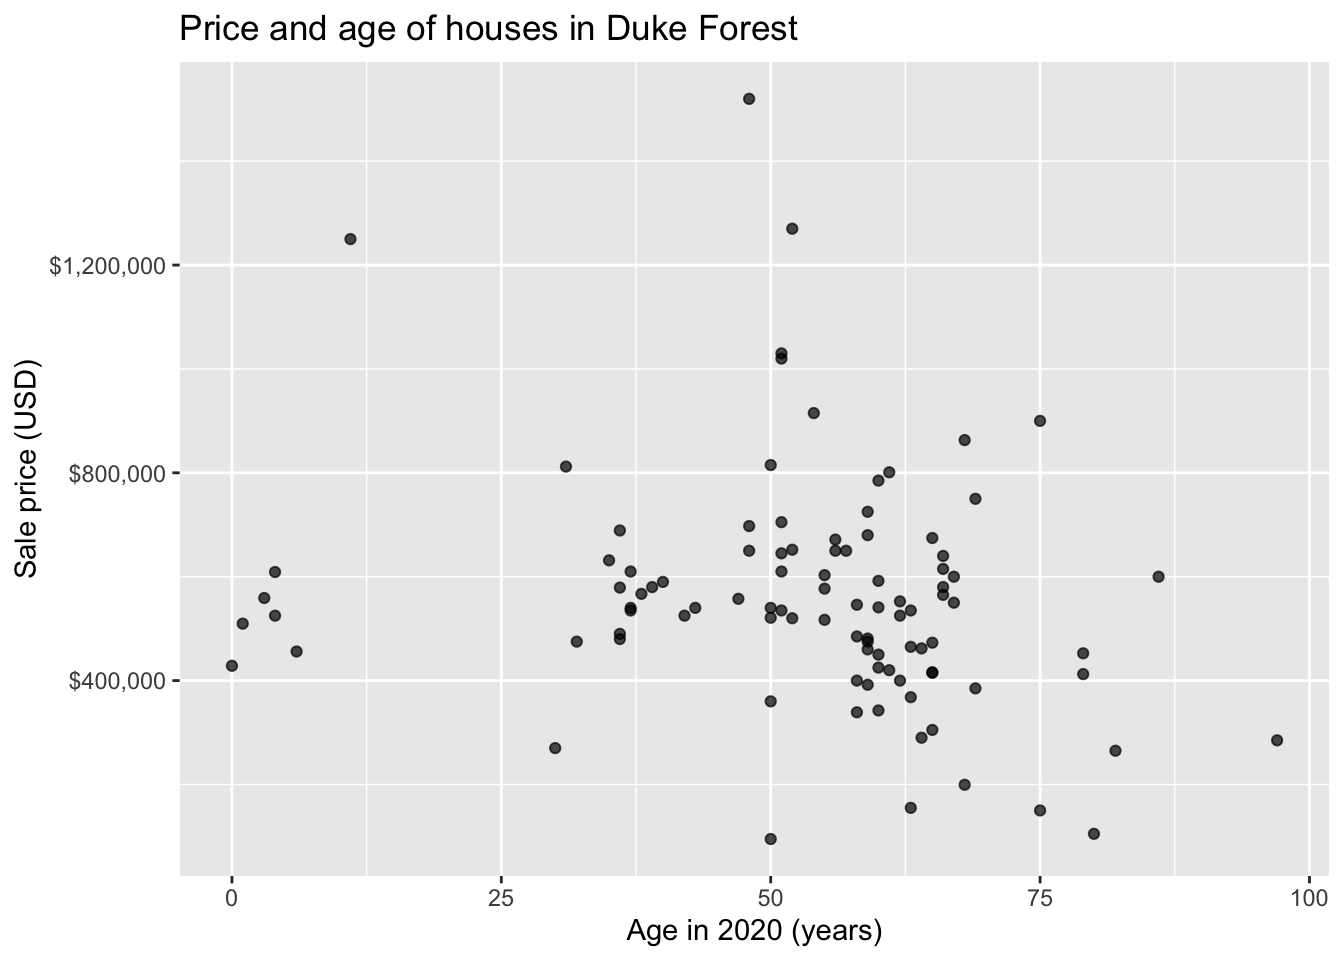
Model
df_fit <- lm(price ~ age_2020, data = duke_forest)

tidy(df_fit) |>
kable(digits = 3)| term | estimate | std.error | statistic | p.value |
|---|---|---|---|---|
| (Intercept) | 690891.015 | 68637.793 | 10.066 | 0.000 |
| age_2020 | -2473.935 | 1225.191 | -2.019 | 0.046 |
Hypothesis test
Tip
For code chunks with fill-in-the-blank code, change code chunk option to #| eval: true once you’ve filled in the code.
State the null and alternative hypotheses
Write the null and alternative hypotheses in words and mathematical notation.
Generate null distribution using permutation
Fill in the code, then set eval: true .
n = 100
set.seed(01232025)

null_dist <- _____ |>
  specify(______) |>
  hypothesize(null = "independence") |>
  generate(reps = _____, type = "permute") |>
  fit()
Visualize distribution
# Code for histogram of null distributionCalculate the p-value.
# get observed fit
observed_fit <- duke_forest |>
  specify(price ~ age_2020) |>
  fit()

# calculate p-value
get_p_value(
  ____,
  obs_stat = ____,
  direction = "two-sided"
)
State conclusion
Write your conclusion in the context of the data. You can use 0.05 as the decision-making threshold.
Bootstrap CI (time permitting)
Construct the bootstrap CI
Construct a 95% bootstrap confidence interval.
Draw conclusion
Interpret the interval in the context of the data.
Is the interval consistent with the conclusion from your hypothesis test? Briefly explain why or why not.
Important
To submit the AE:
- Render the document to produce the PDF with all of your work from today’s class.
- Push all your work to your
ae-05repo on GitHub. (You do not submit AEs on Gradescope).