The big picture
Analyzing multivariable relationships + Reproducibility
Jan 14, 2025
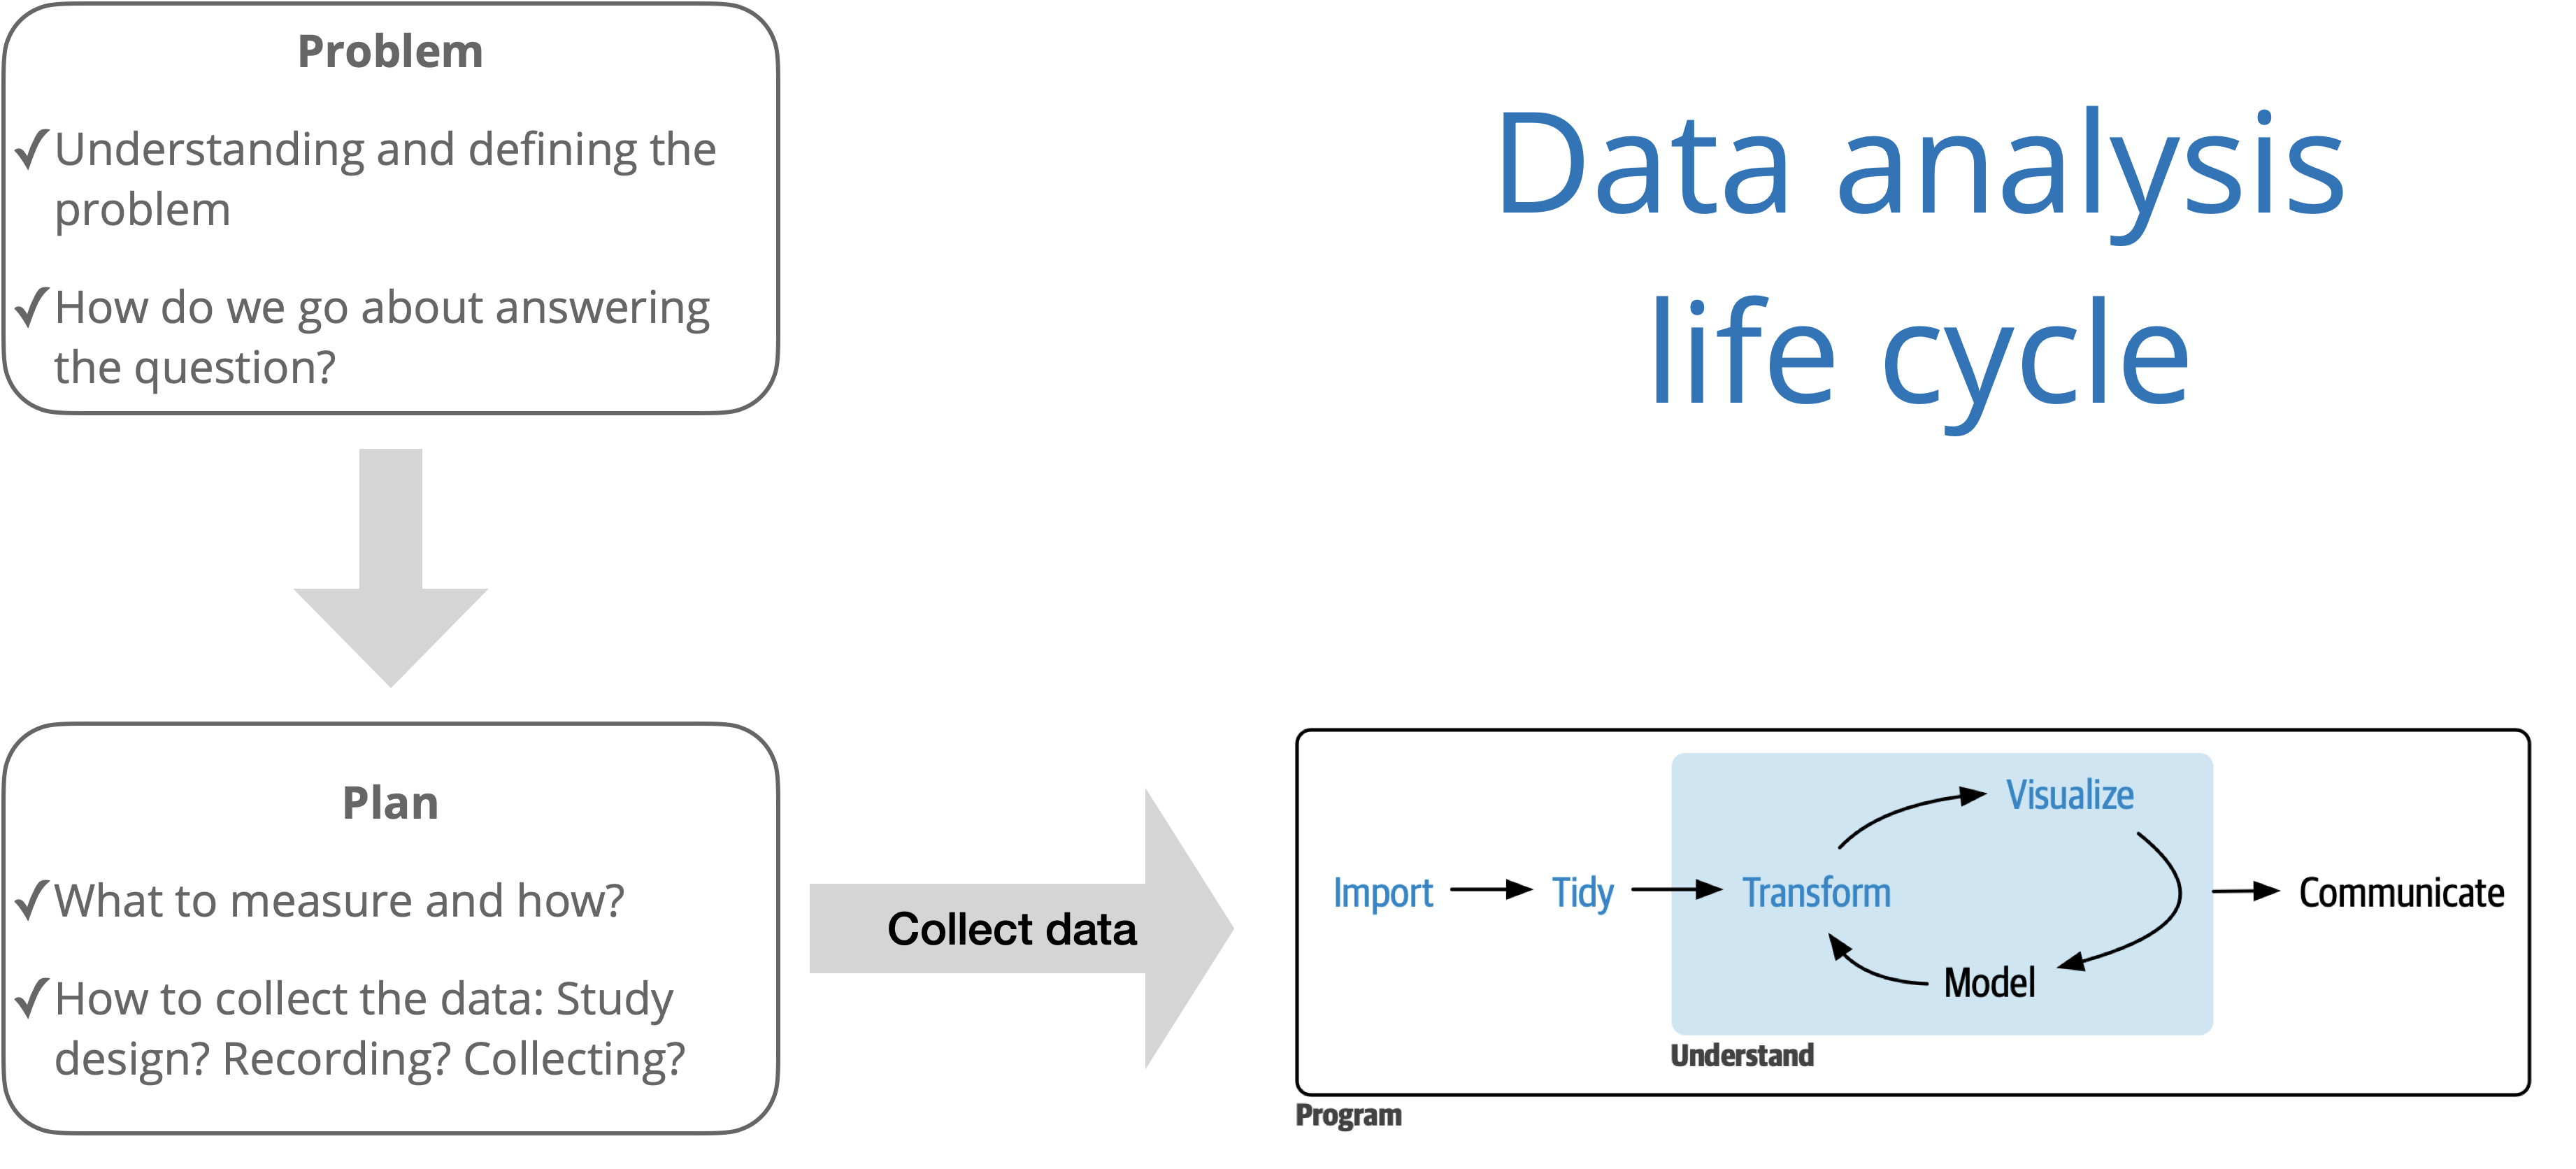
Source: R for Data Science with additions from The Art of Statistics: How to Learn from Data.
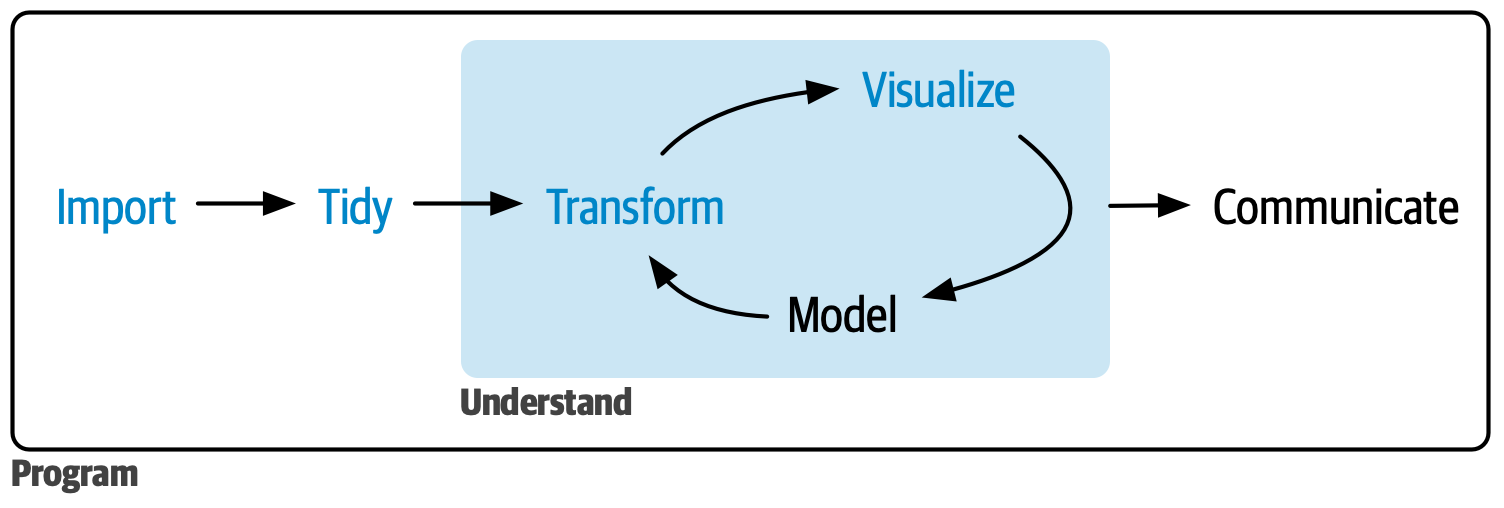
Source:R for Data Science
Why is reproducibility important?

Originally reported “the intervention, compared with usual care, resulted in a fewer number of mean COPD-related hospitalizations and emergency department visits at 6 months per participant.”
There were actually more COPD-related hospitalizations and emergency department visits in the intervention group compared to the control group
Mixed up the intervention vs. control group using “0/1” coding
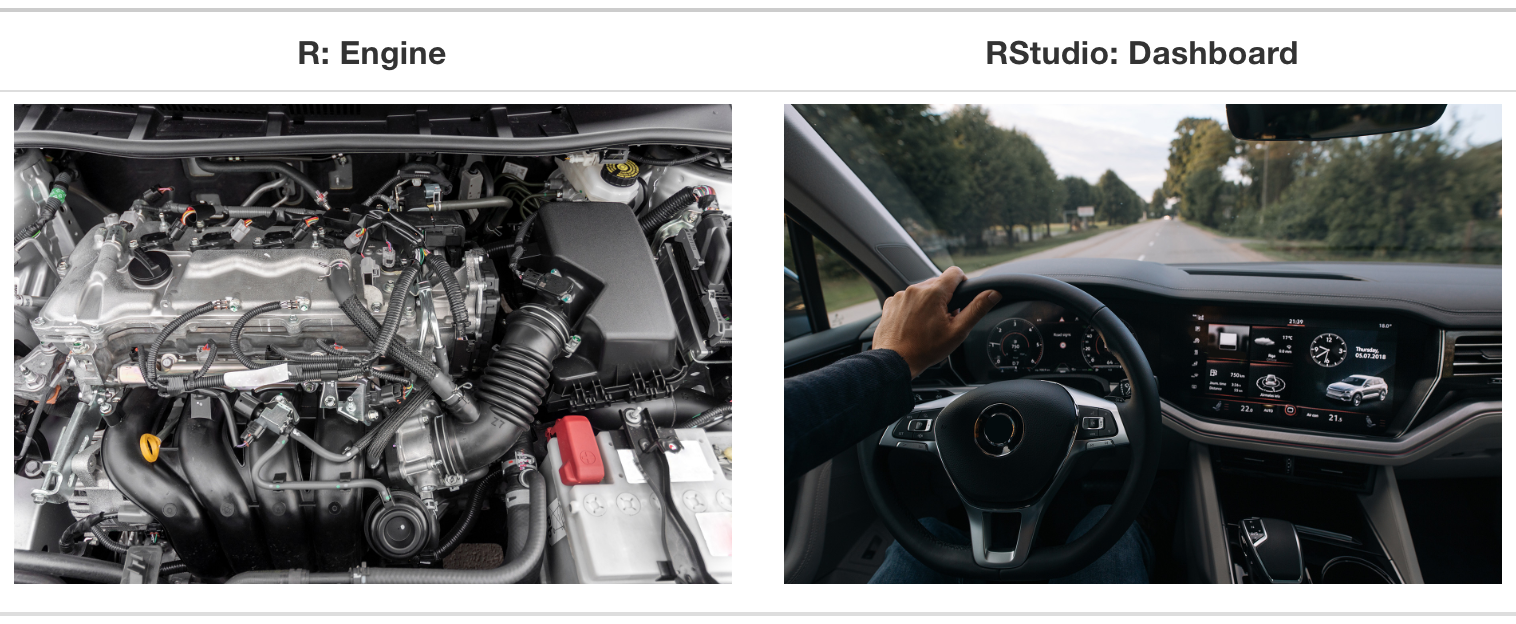
R and RStudio
R is a statistical programming language
RStudio is a convenient interface for R (an integrated development environment, IDE)
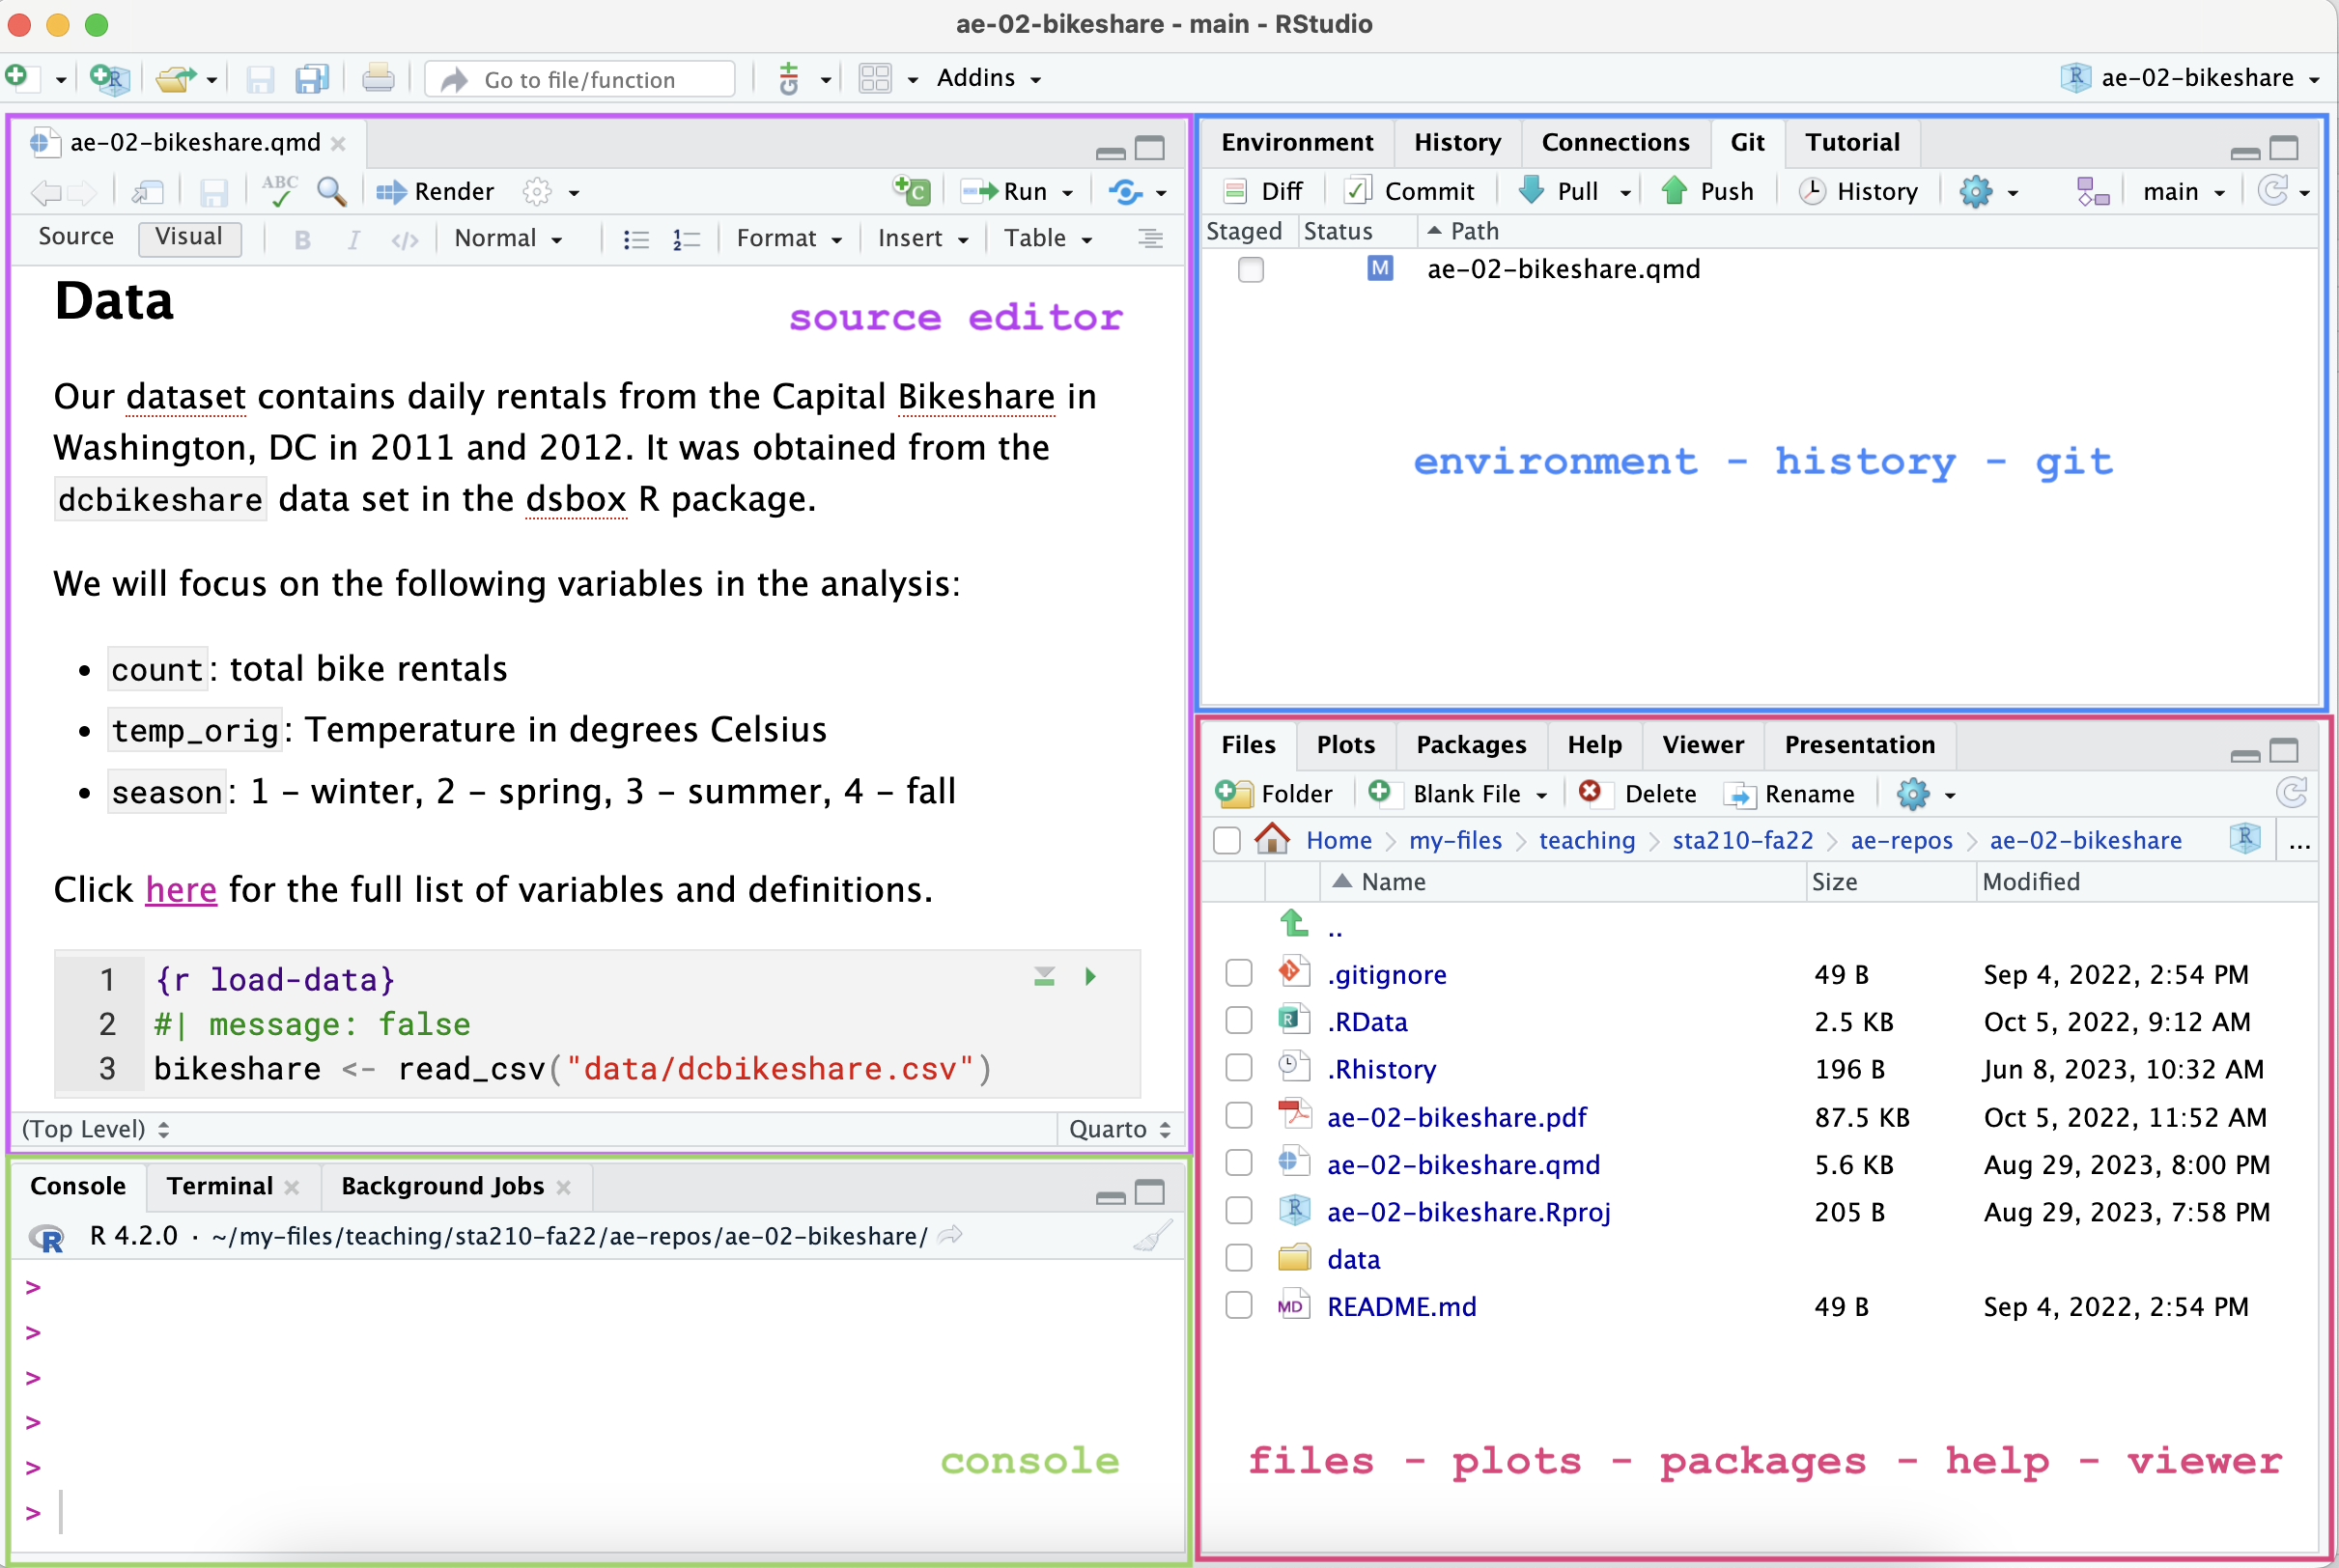
RStudio IDE
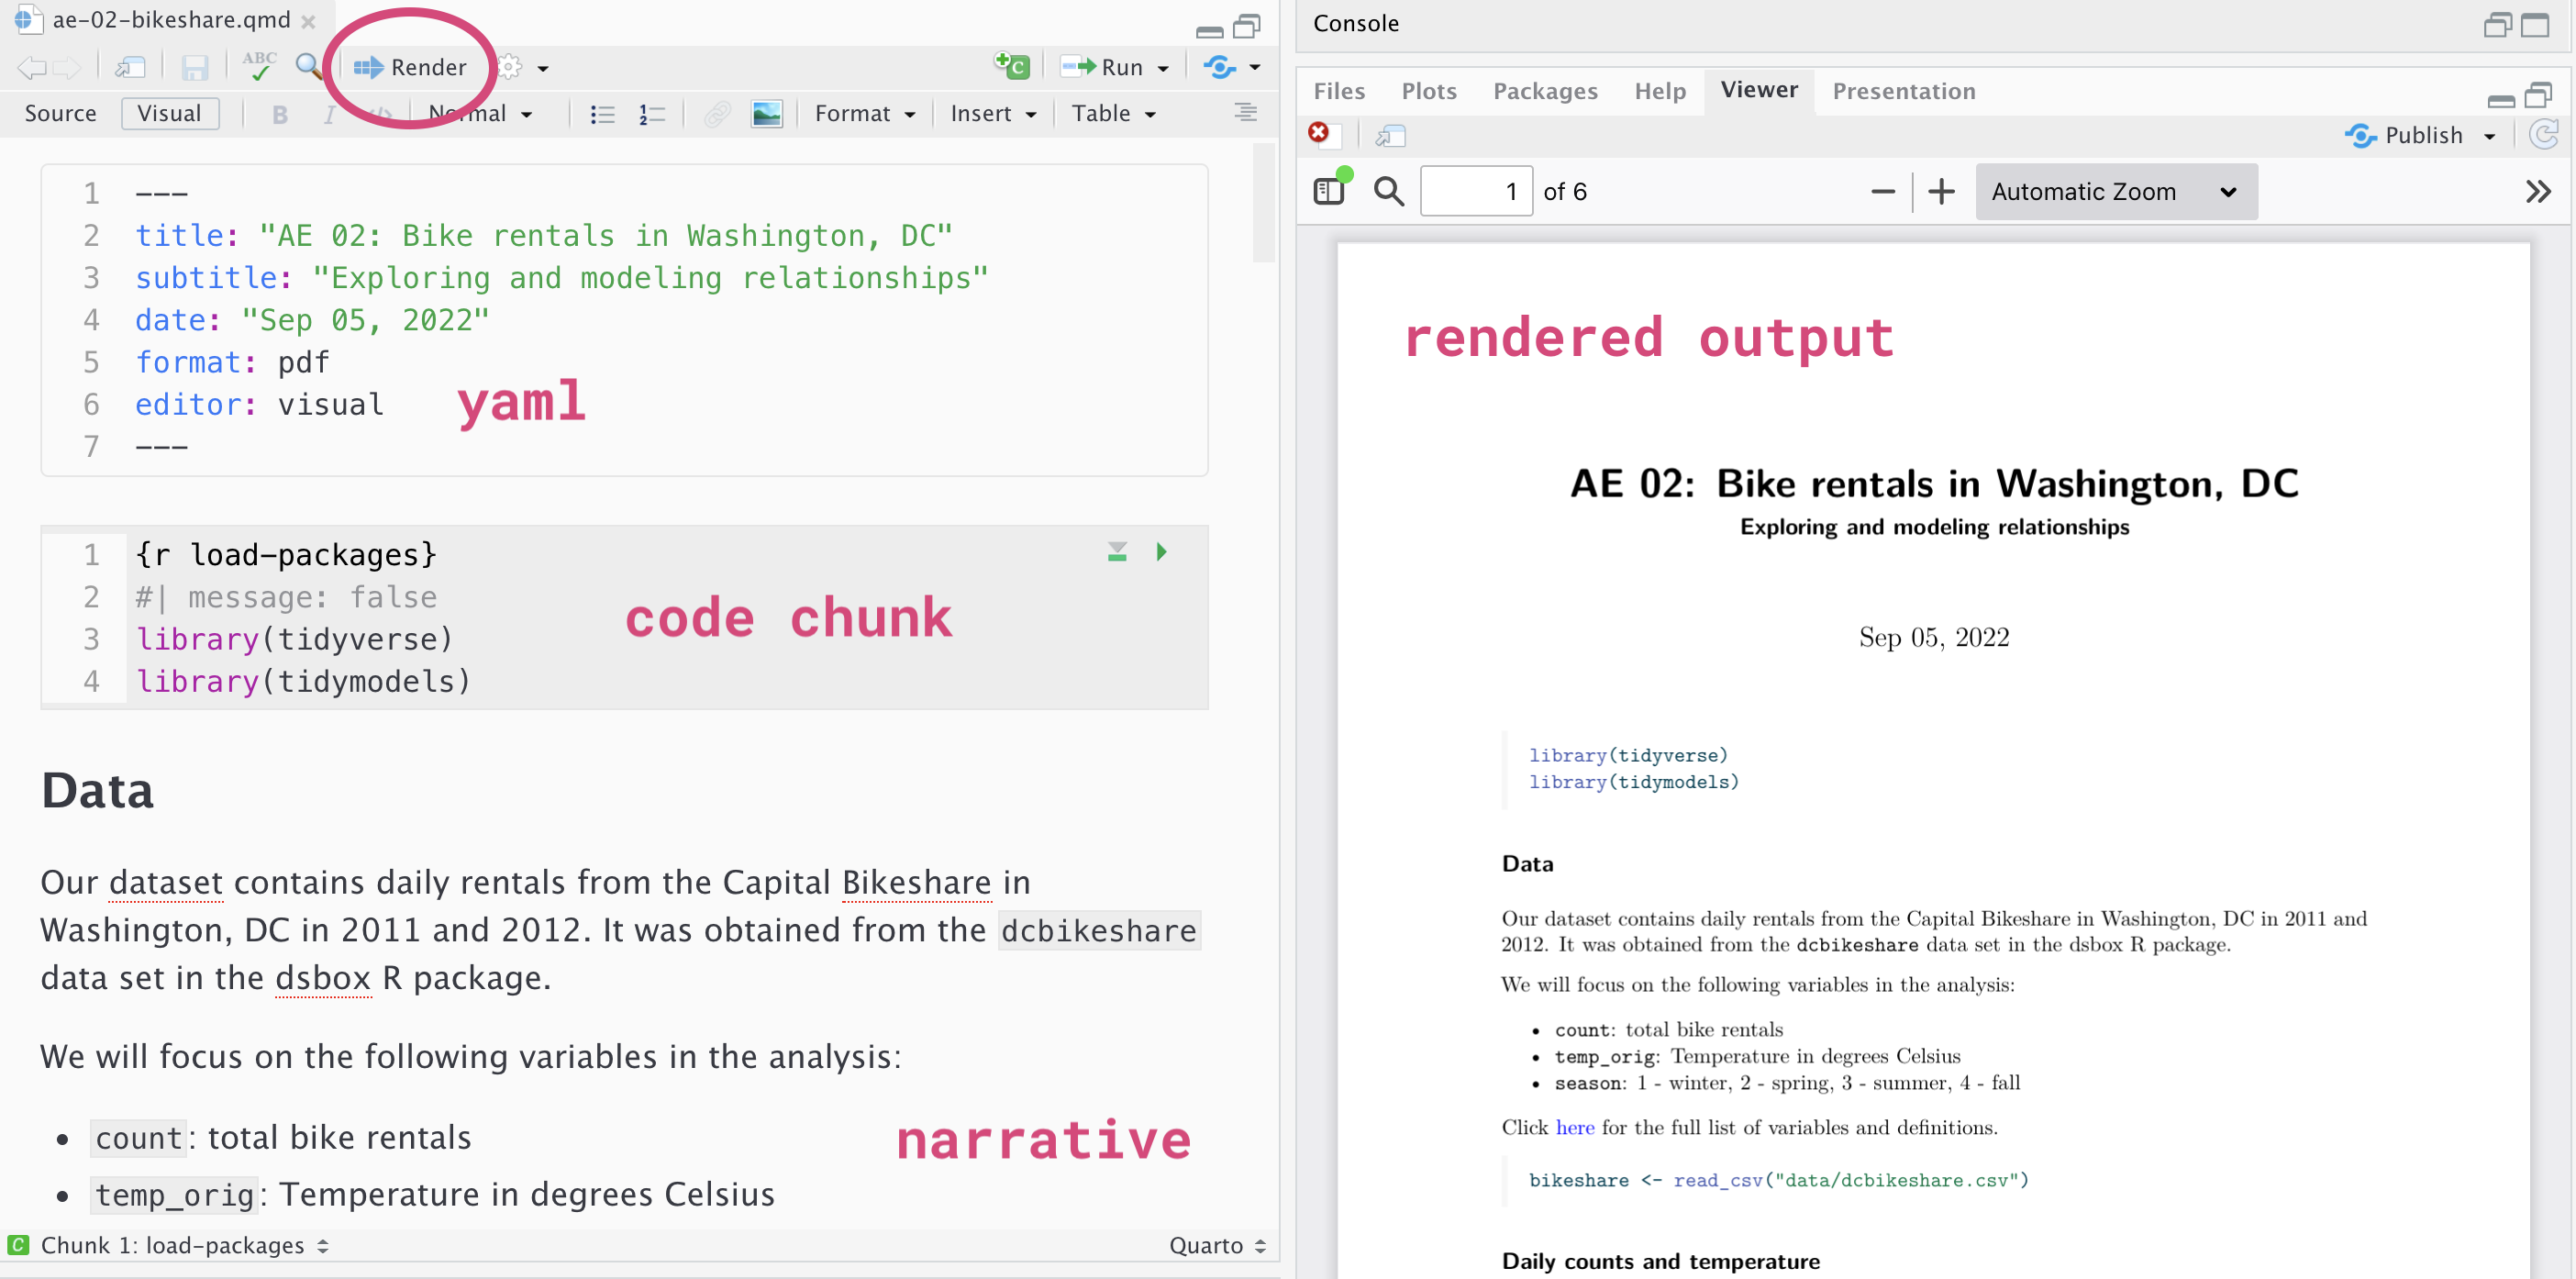
Quarto
What is versioning?
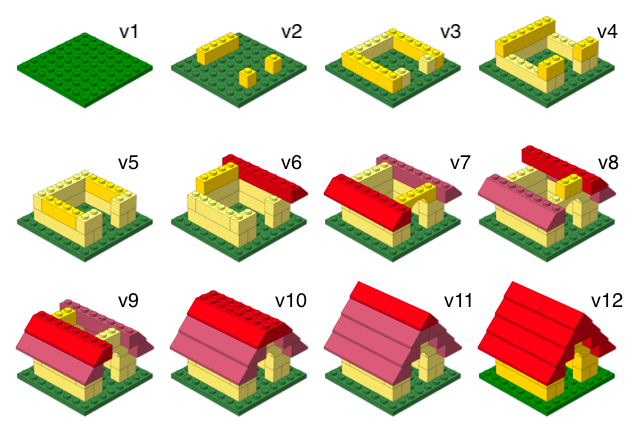
What is versioning?
with human readable messages

Why do we need version control?
Provides a clear record of how the analysis methods evolved. This makes analysis auditable and thus more trustworthy and reliable. (Ostblom and Timbers 2022)
git and GitHub
- git is a version control system – like “Track Changes” features from Microsoft Word.
- GitHub is the home for your git-based projects on the internet (like DropBox but much better).
- There are a lot of git commands and very few people know them all. 99% of the time you will use git to add, commit, push, and pull.
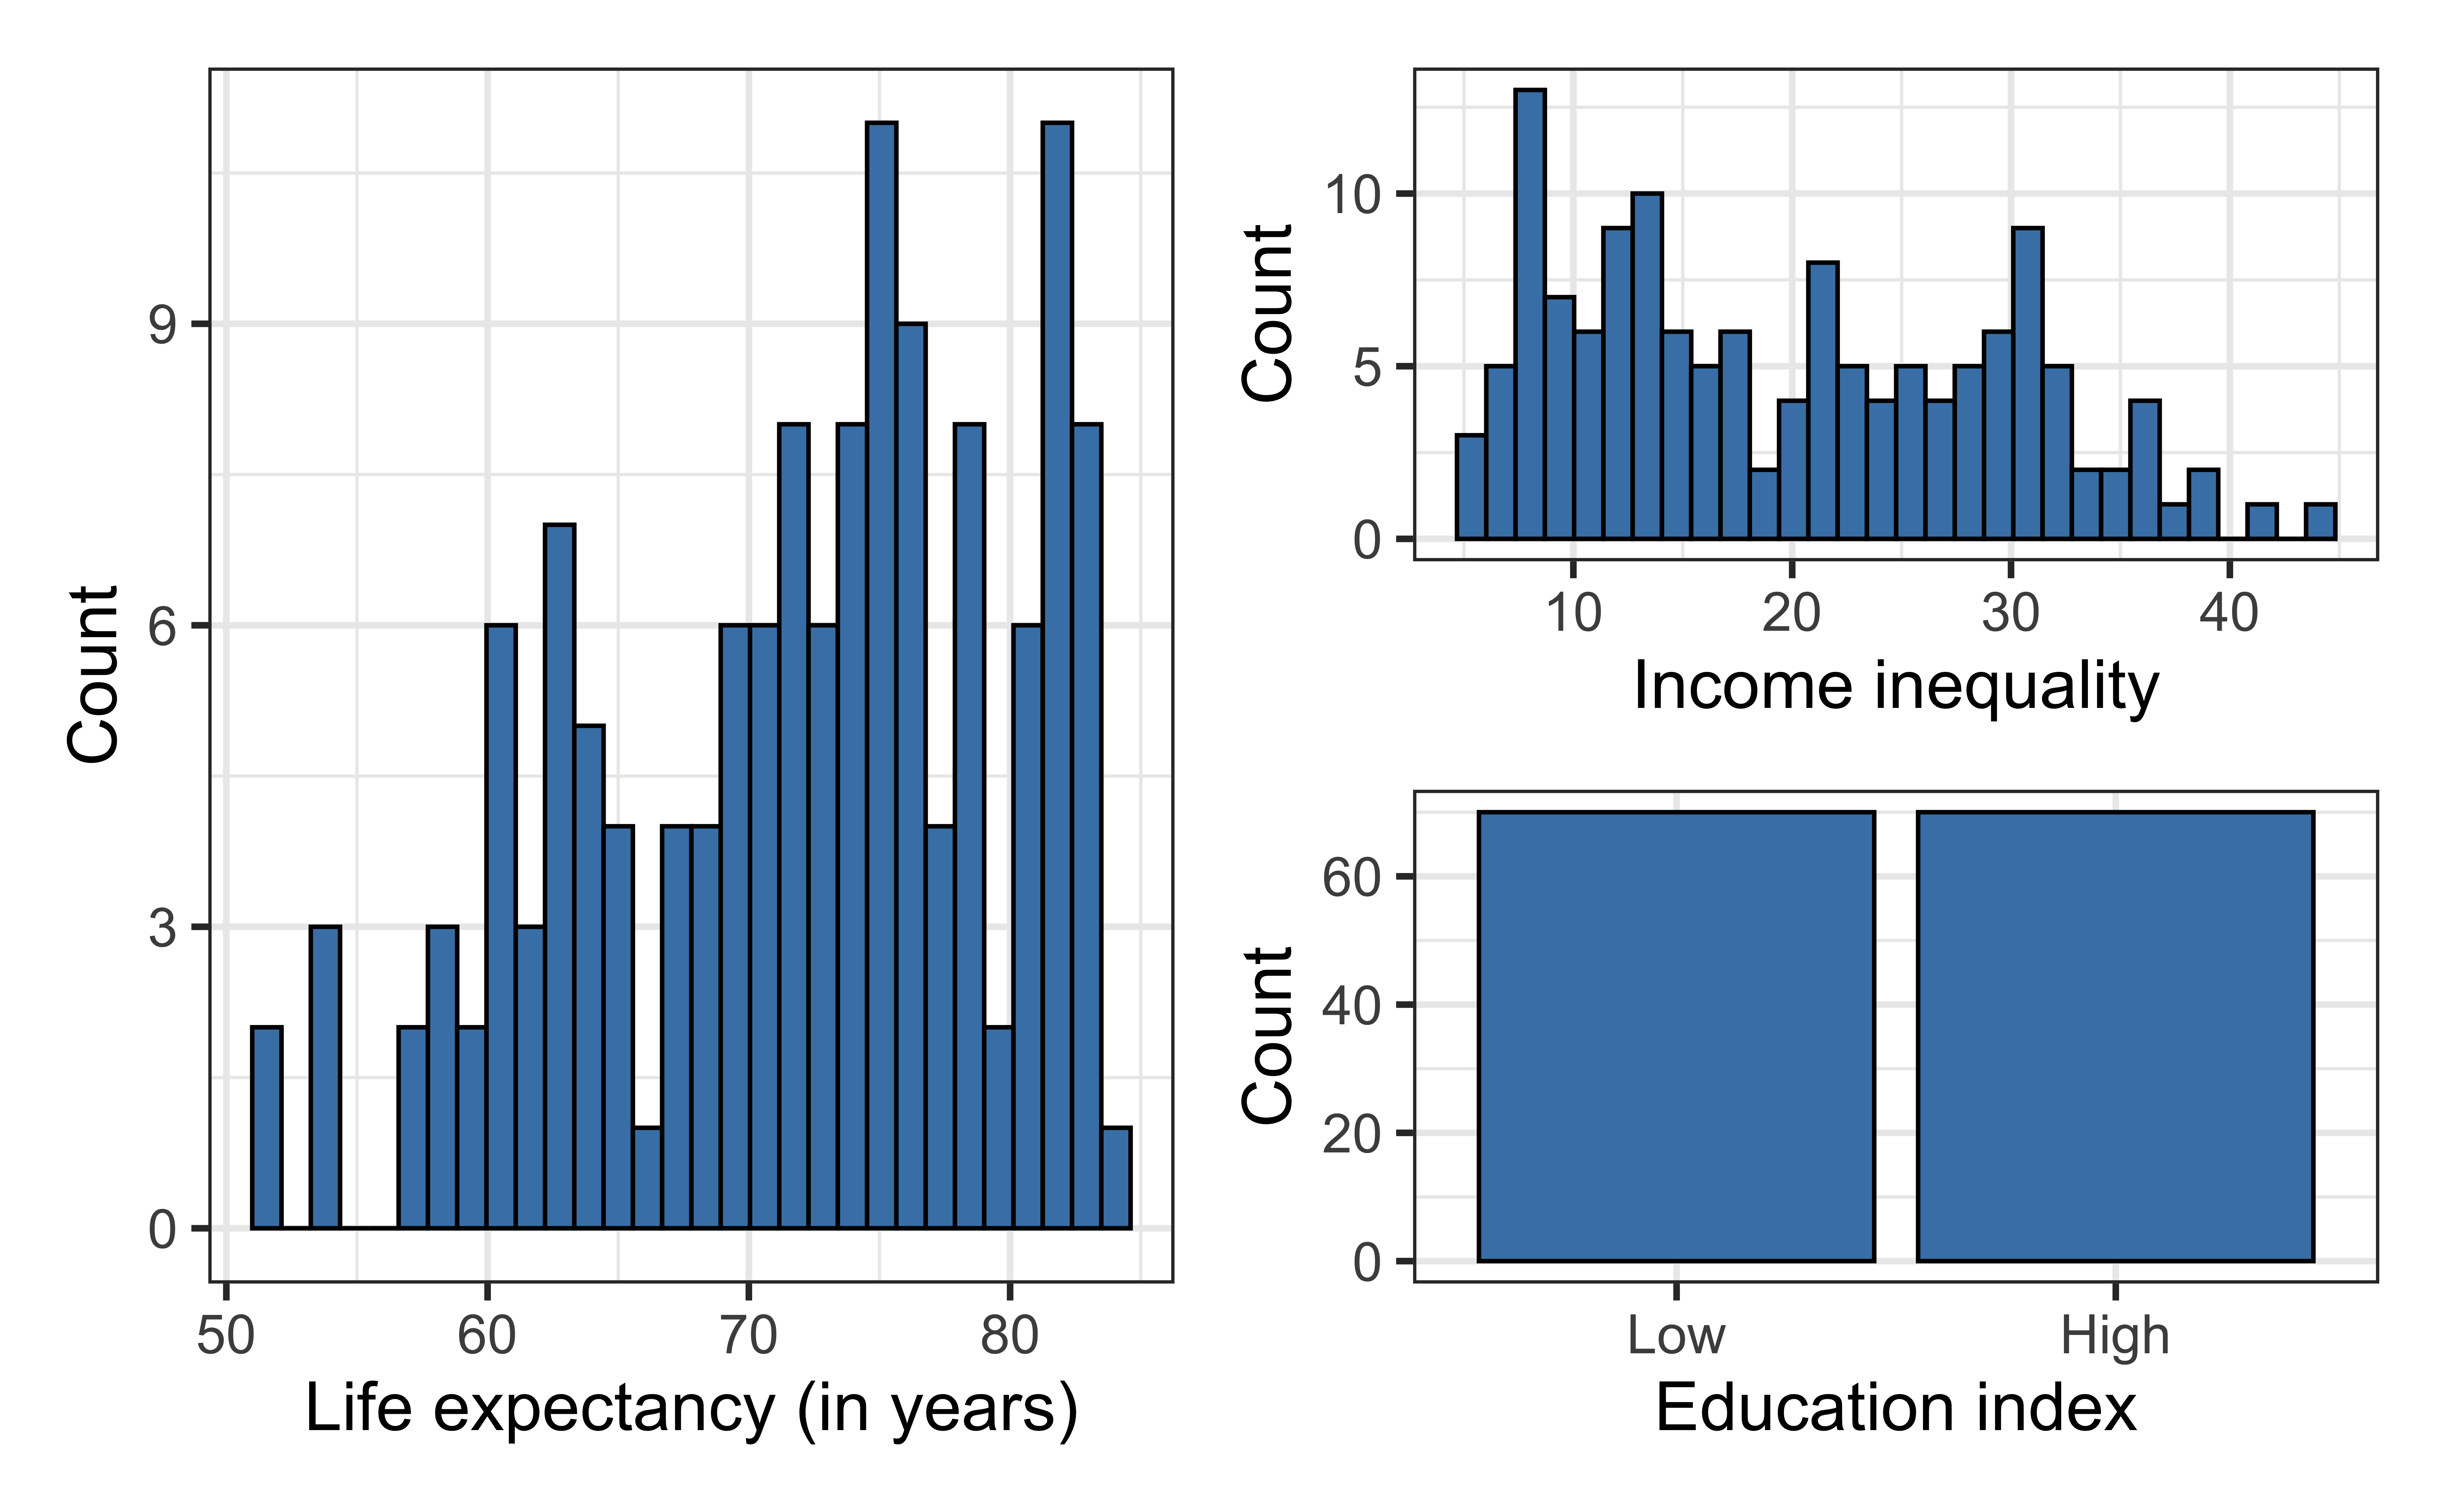
Univariate exploratory data analysis
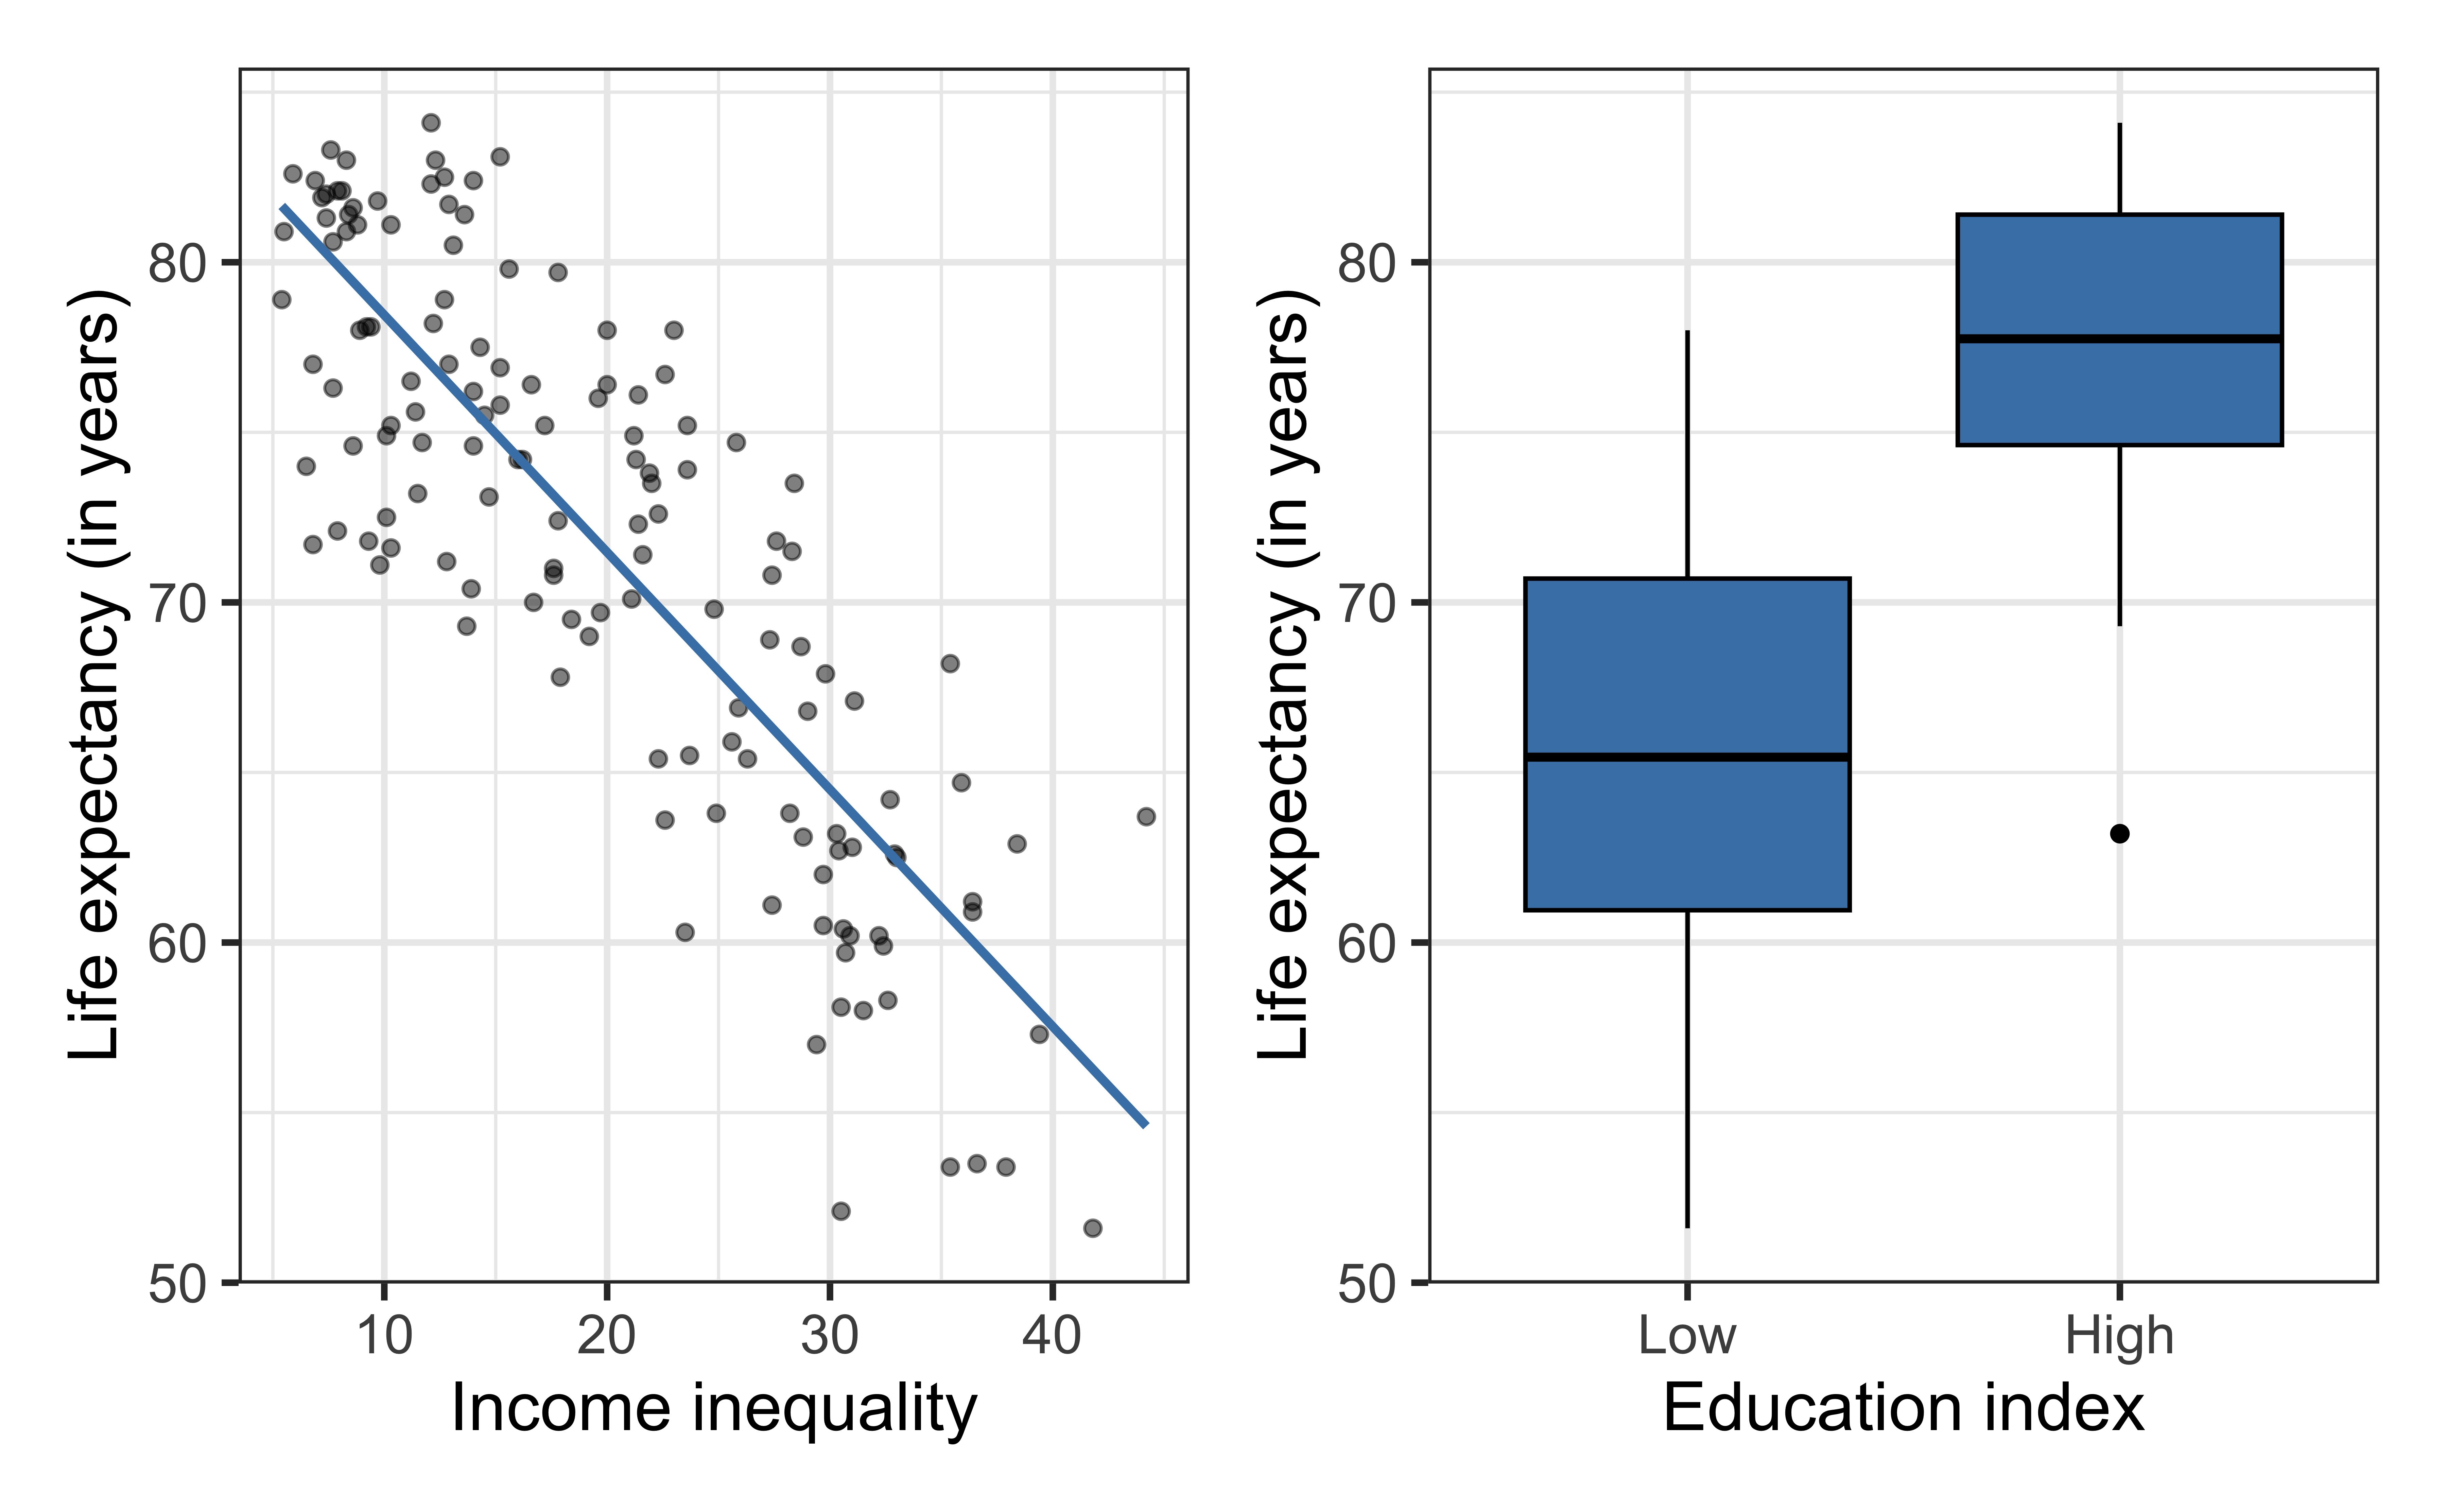
Bivariate exploratory data analysis
life_exp vs. income_inequality
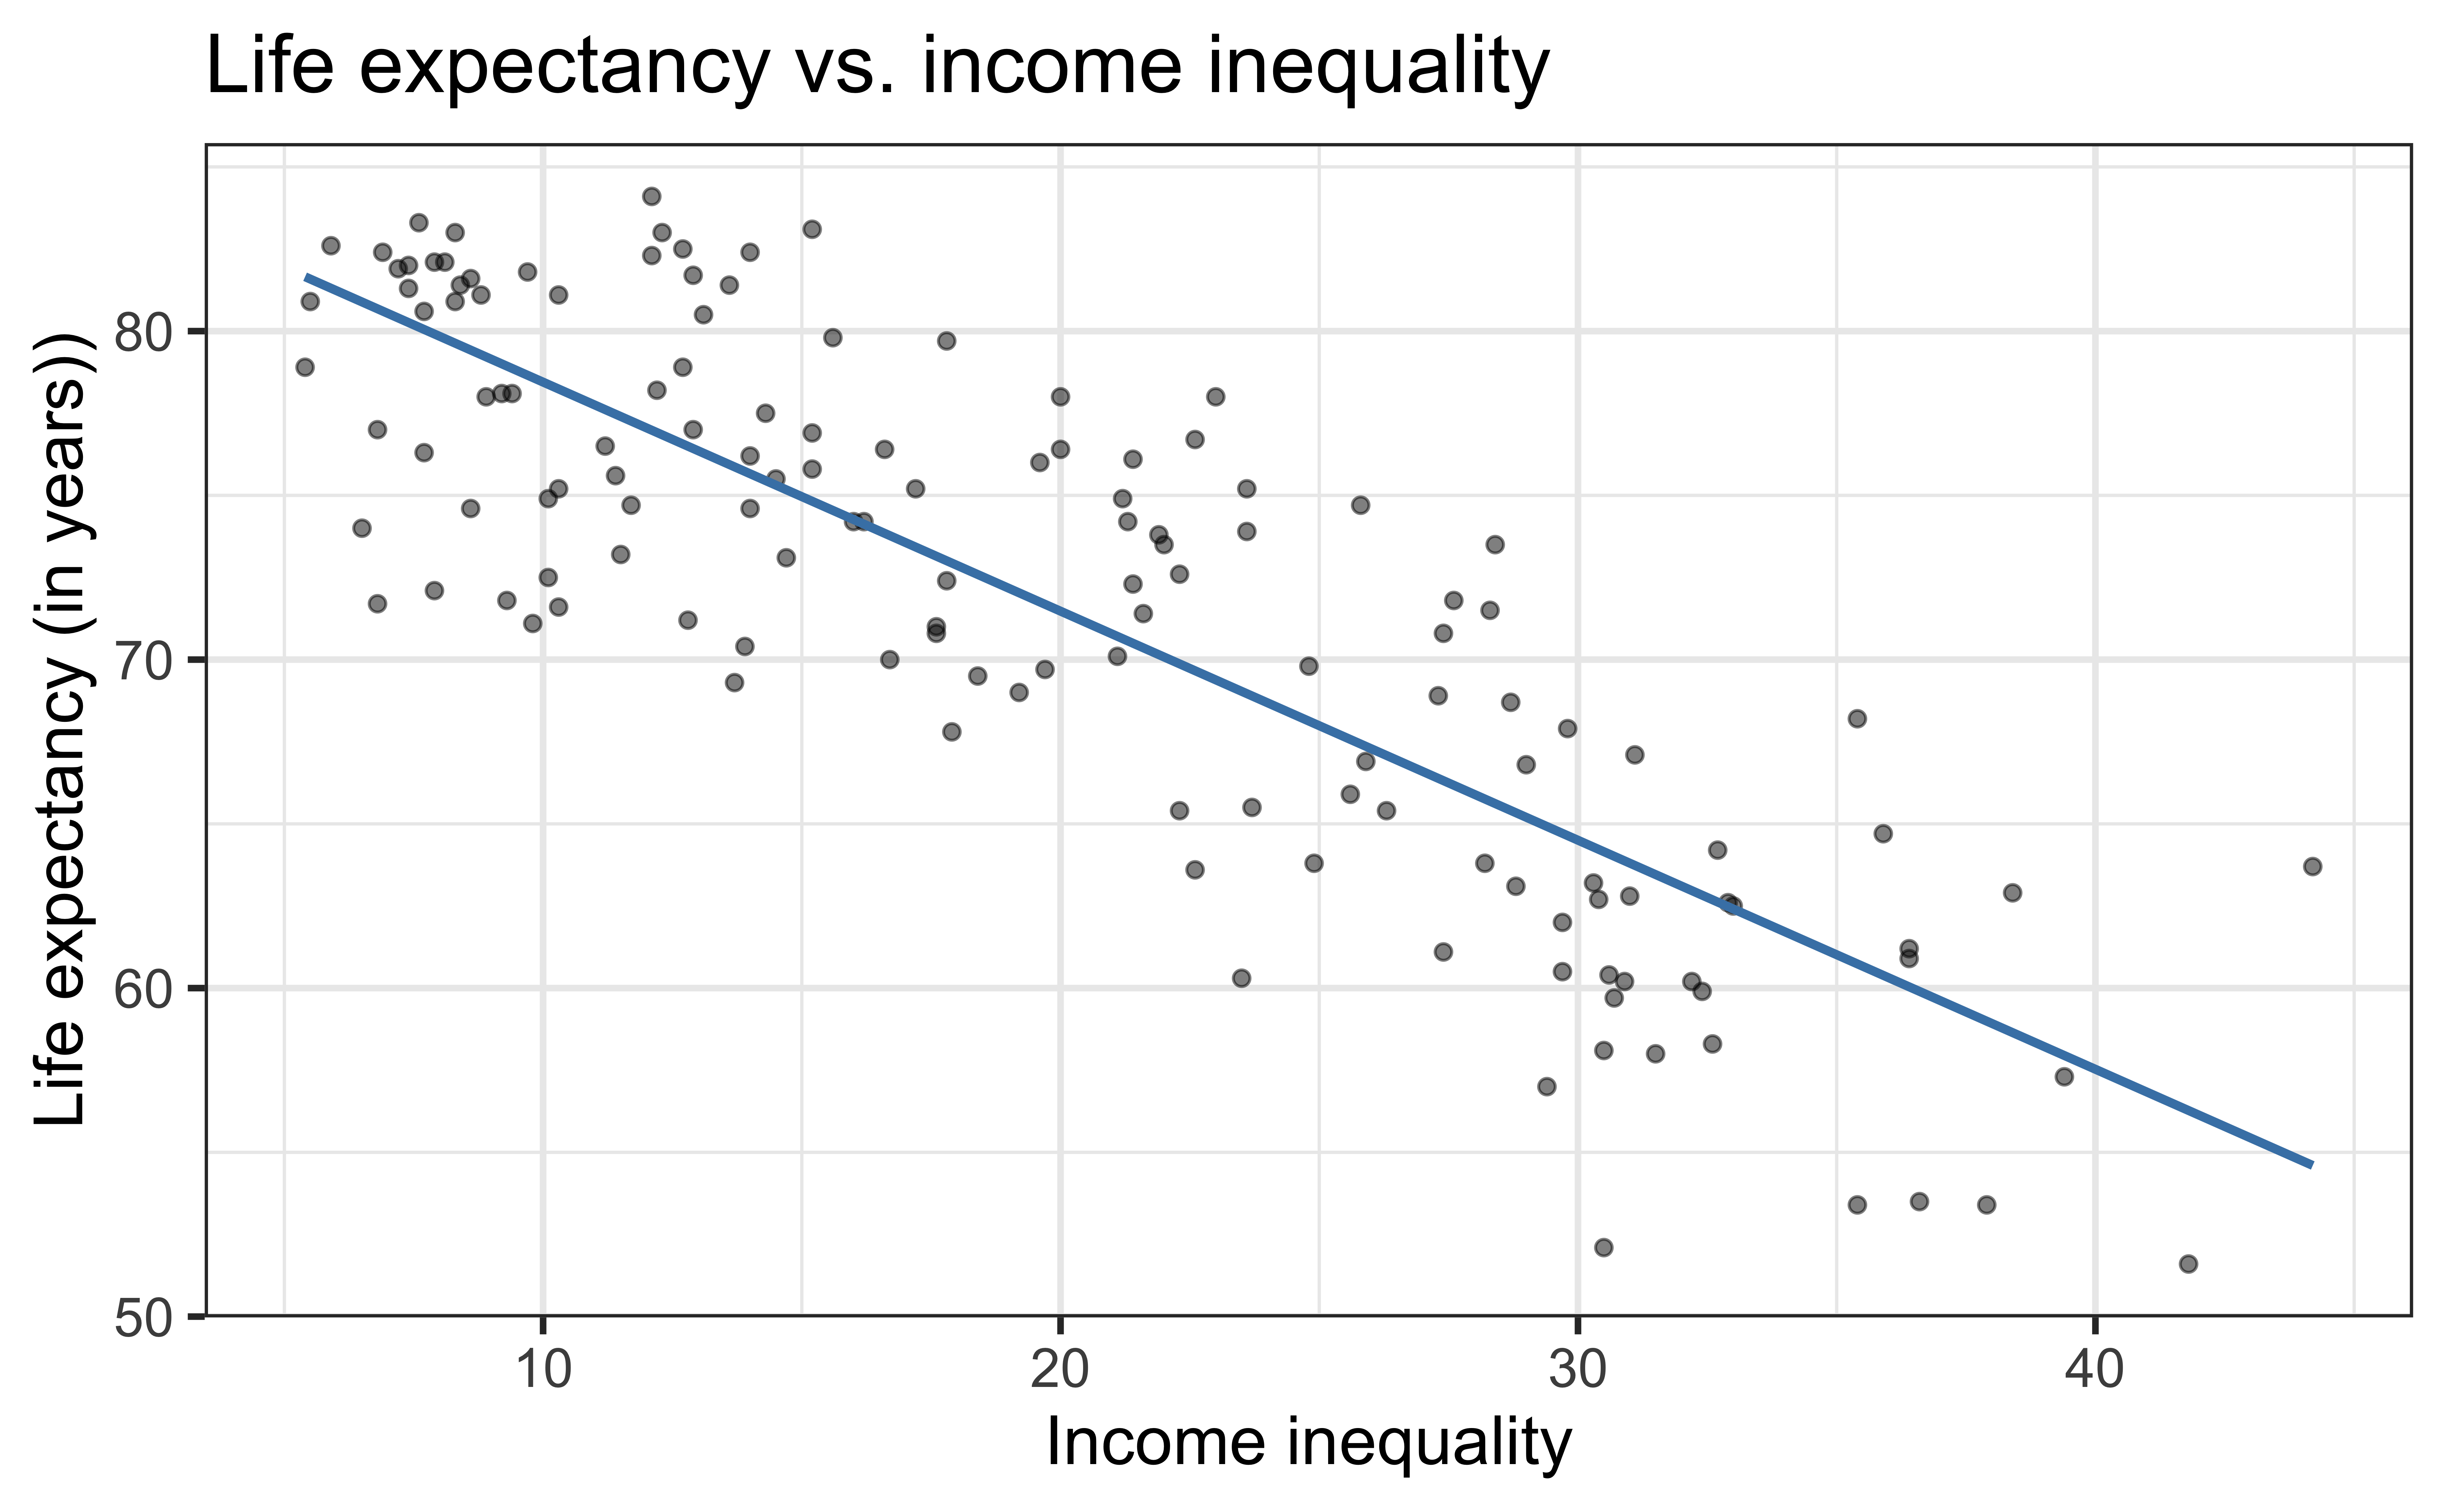
\[\widehat{\text{life_exp}} = \hat{\beta}_0 + \hat{\beta}_1 ~\text{income_inequality}\]
life_exp vs. income_inequality + education
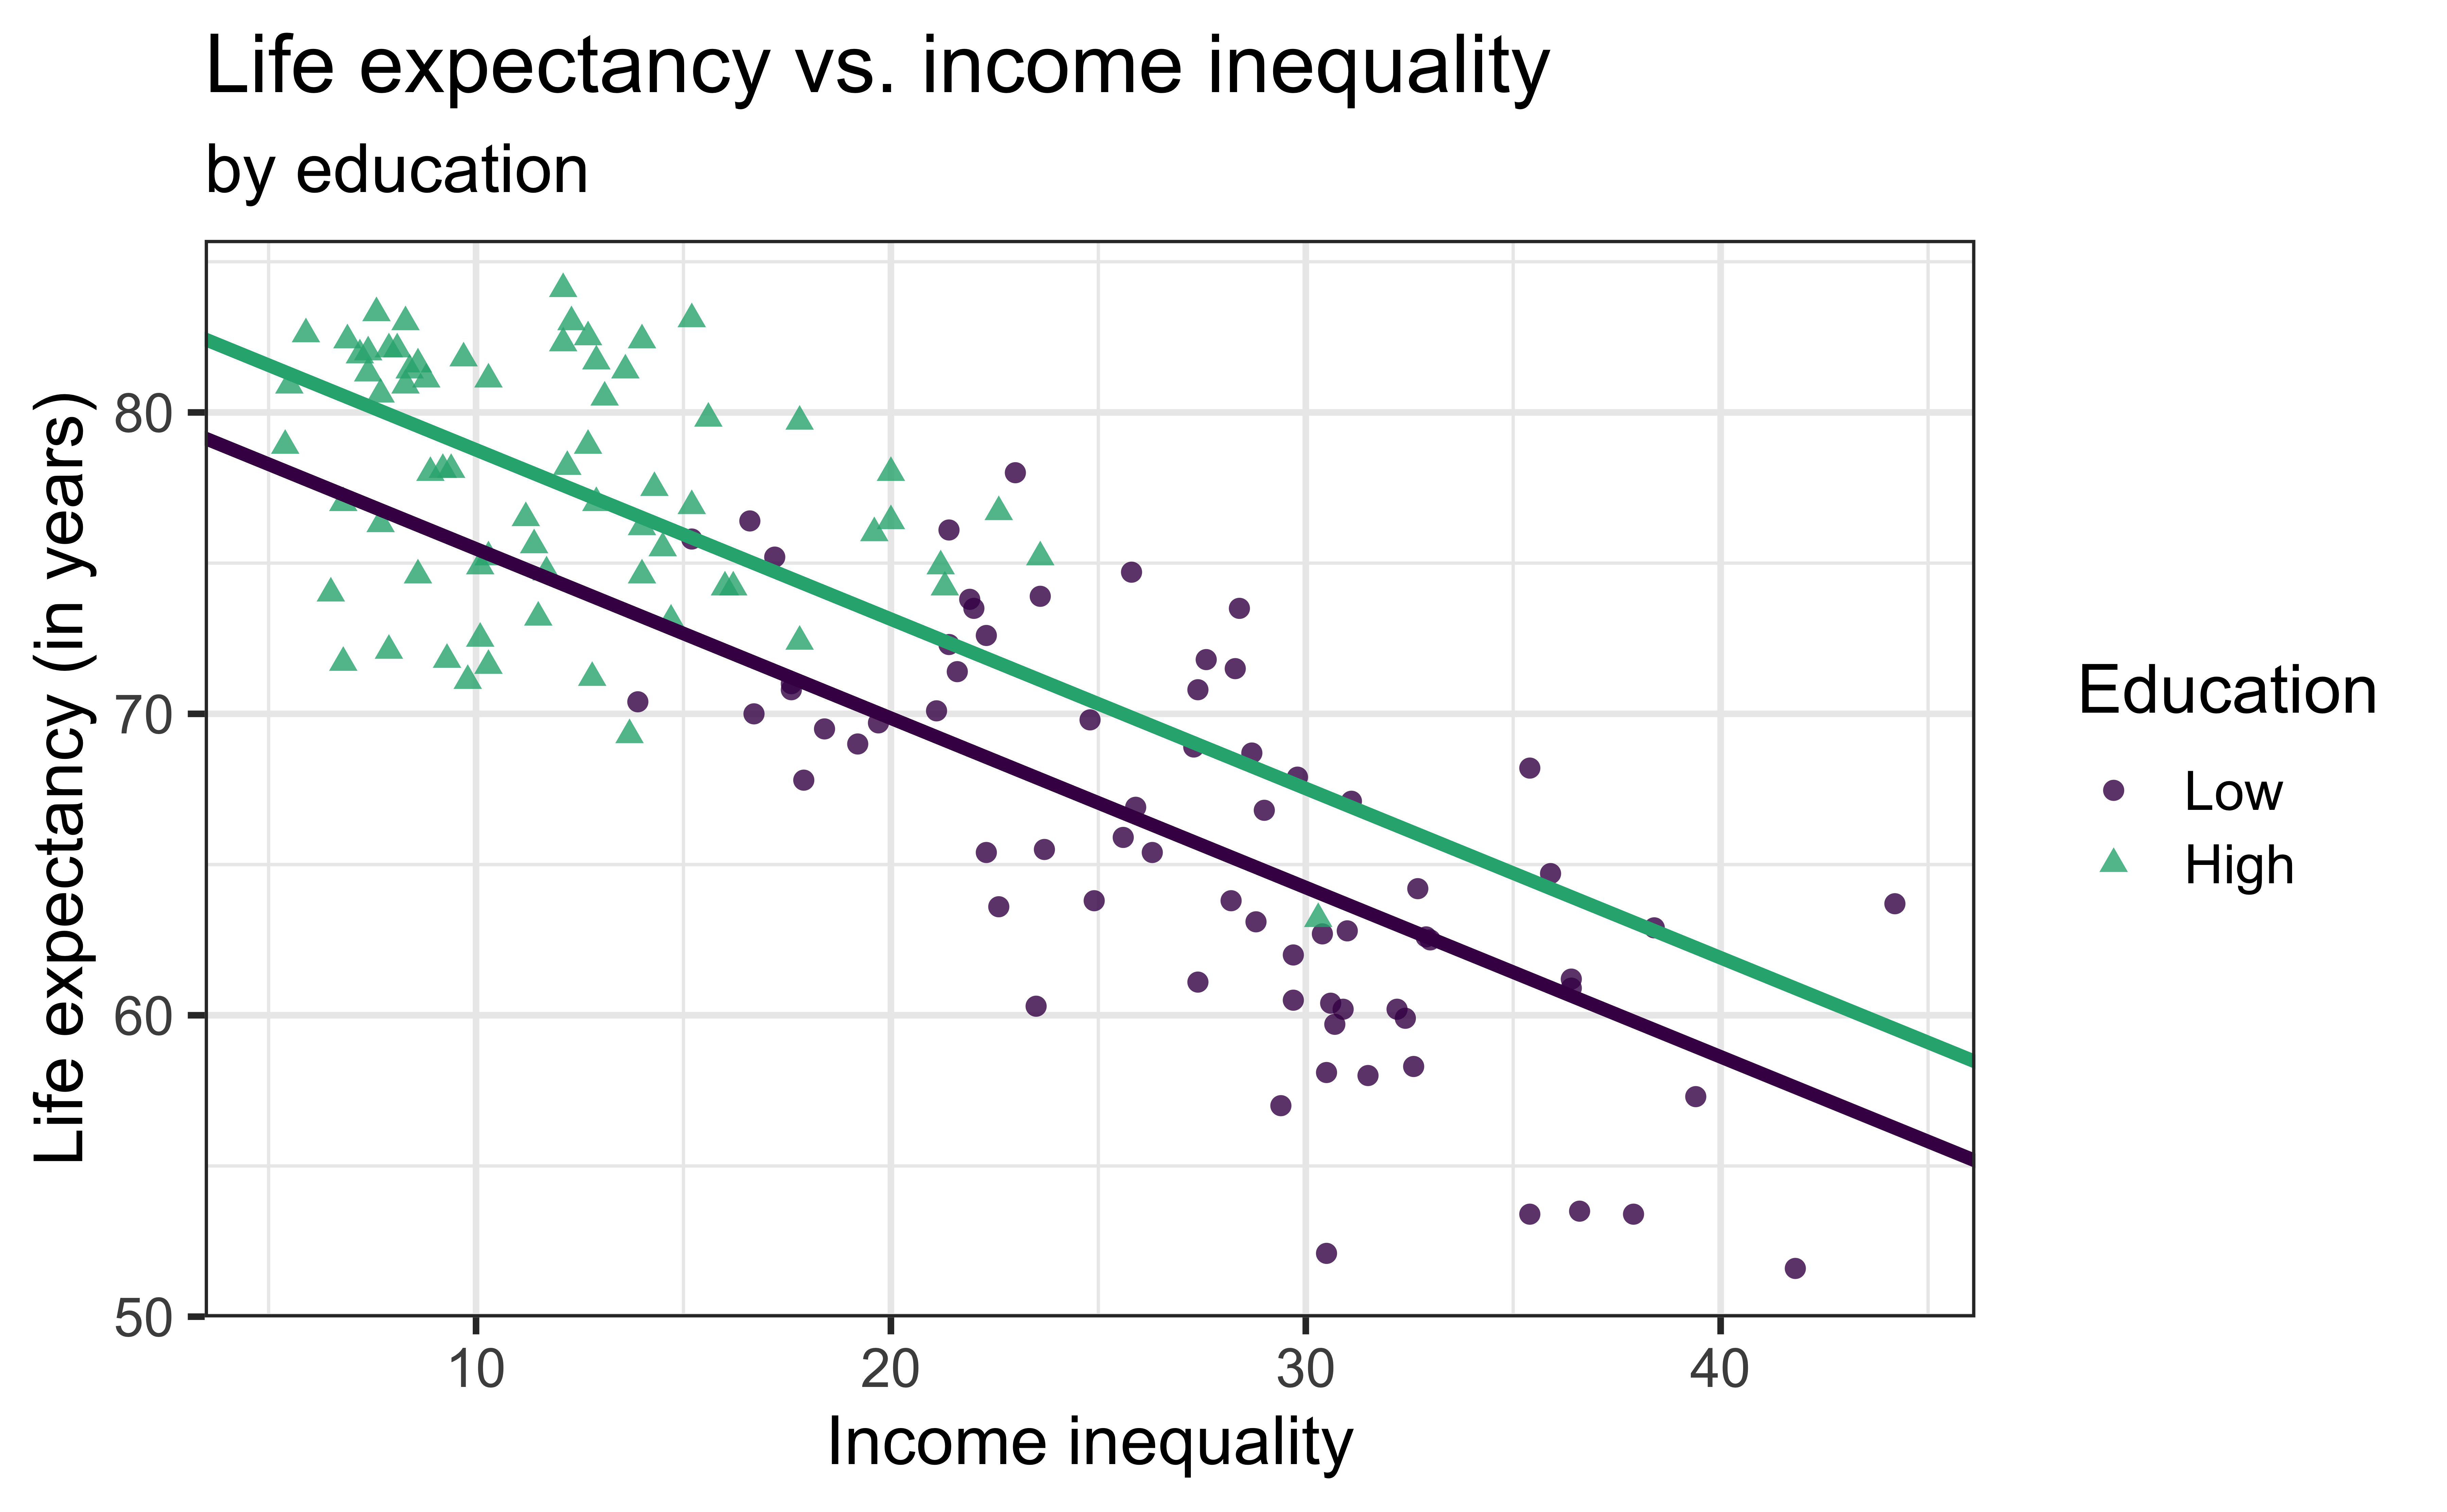
\[\widehat{\text{life_exp}} = \hat{\beta}_0 + \hat{\beta}_1 ~\text{income_inequality} + \hat{\beta}_2 ~\text{education}\]
life_exp vs. income_inequality + education (with interaction)
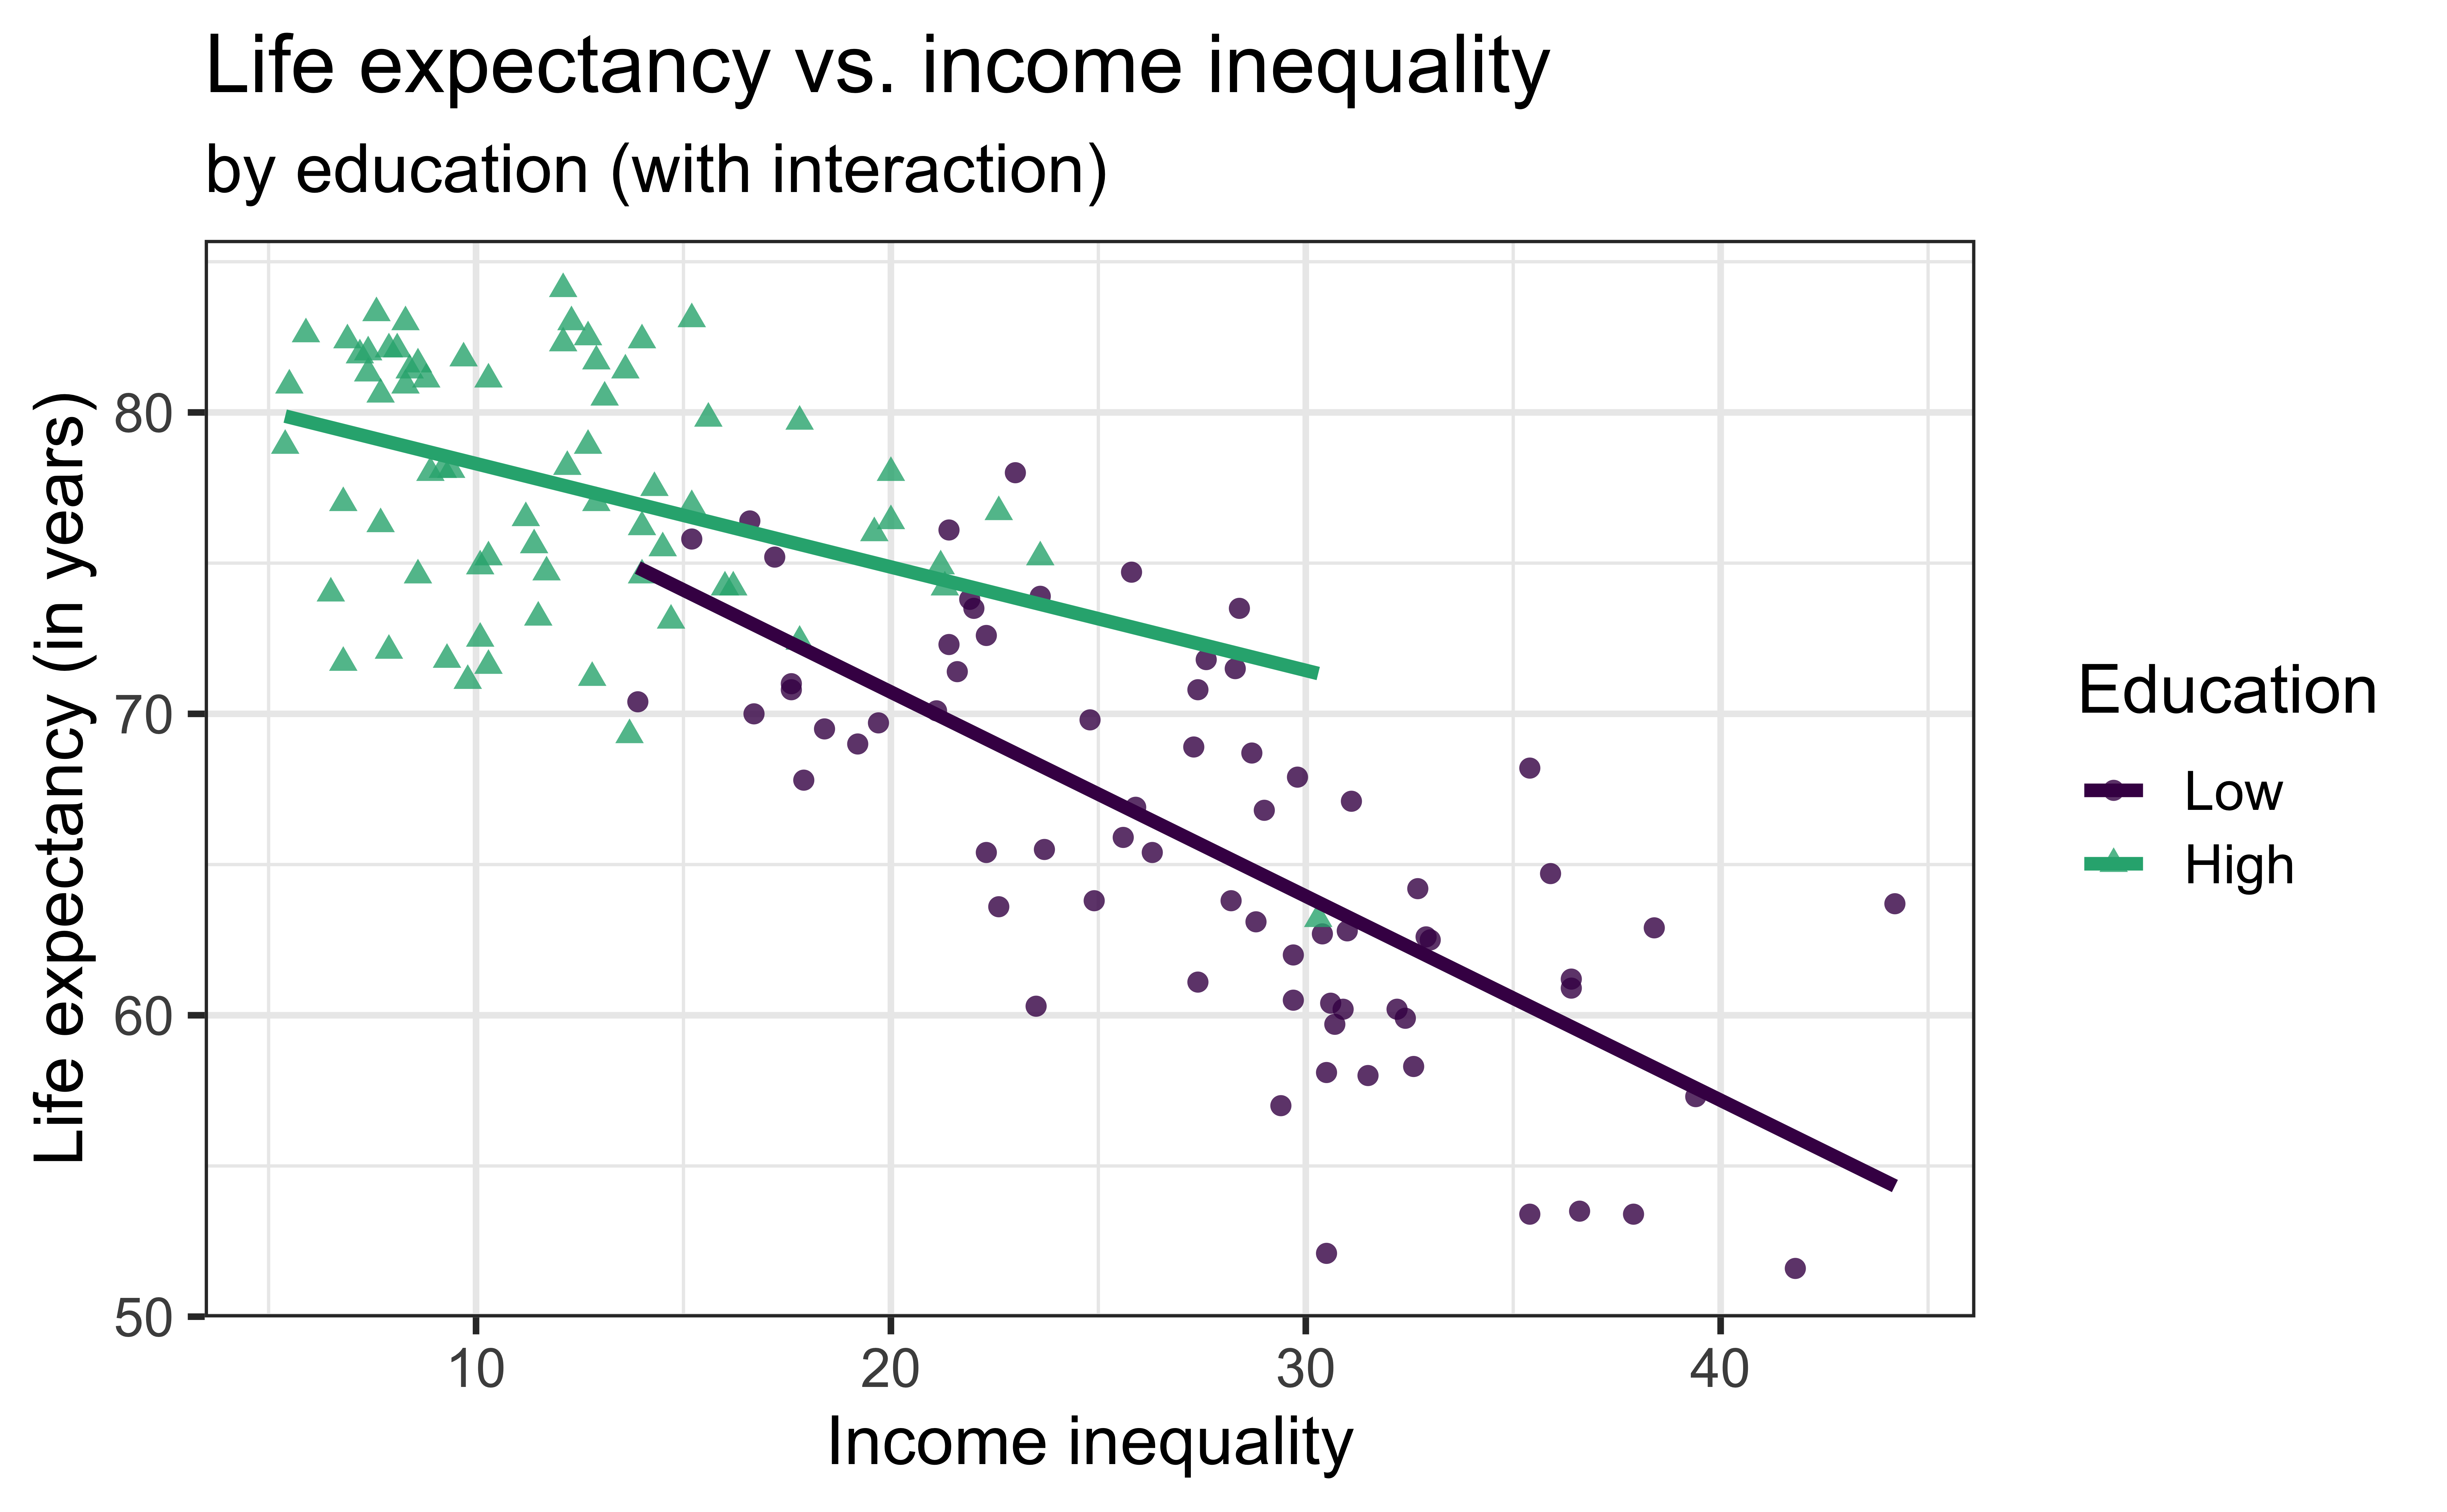
\[{\small \widehat{\text{life_exp}} = \hat{\beta}_0 + \hat{\beta}_1 ~\text{income_inequality} + \hat{\beta}_2 ~\text{education} + \hat{\beta}_3 ~ \text{income_inequality} \times \text{education}}\]