Linear regression
Jan 27, 2025
You do not have to finish the lab in class, they will always be due Thursday. One work strategy is to get through portions that you think will be most challenging (which initially might be the coding component) during lab when a TA can help you on the spot and leave the narrative writing until later.
Do not pressure each other to finish early (particularly once you start working on teams); use the time wisely to really learn the material and produce a quality report.
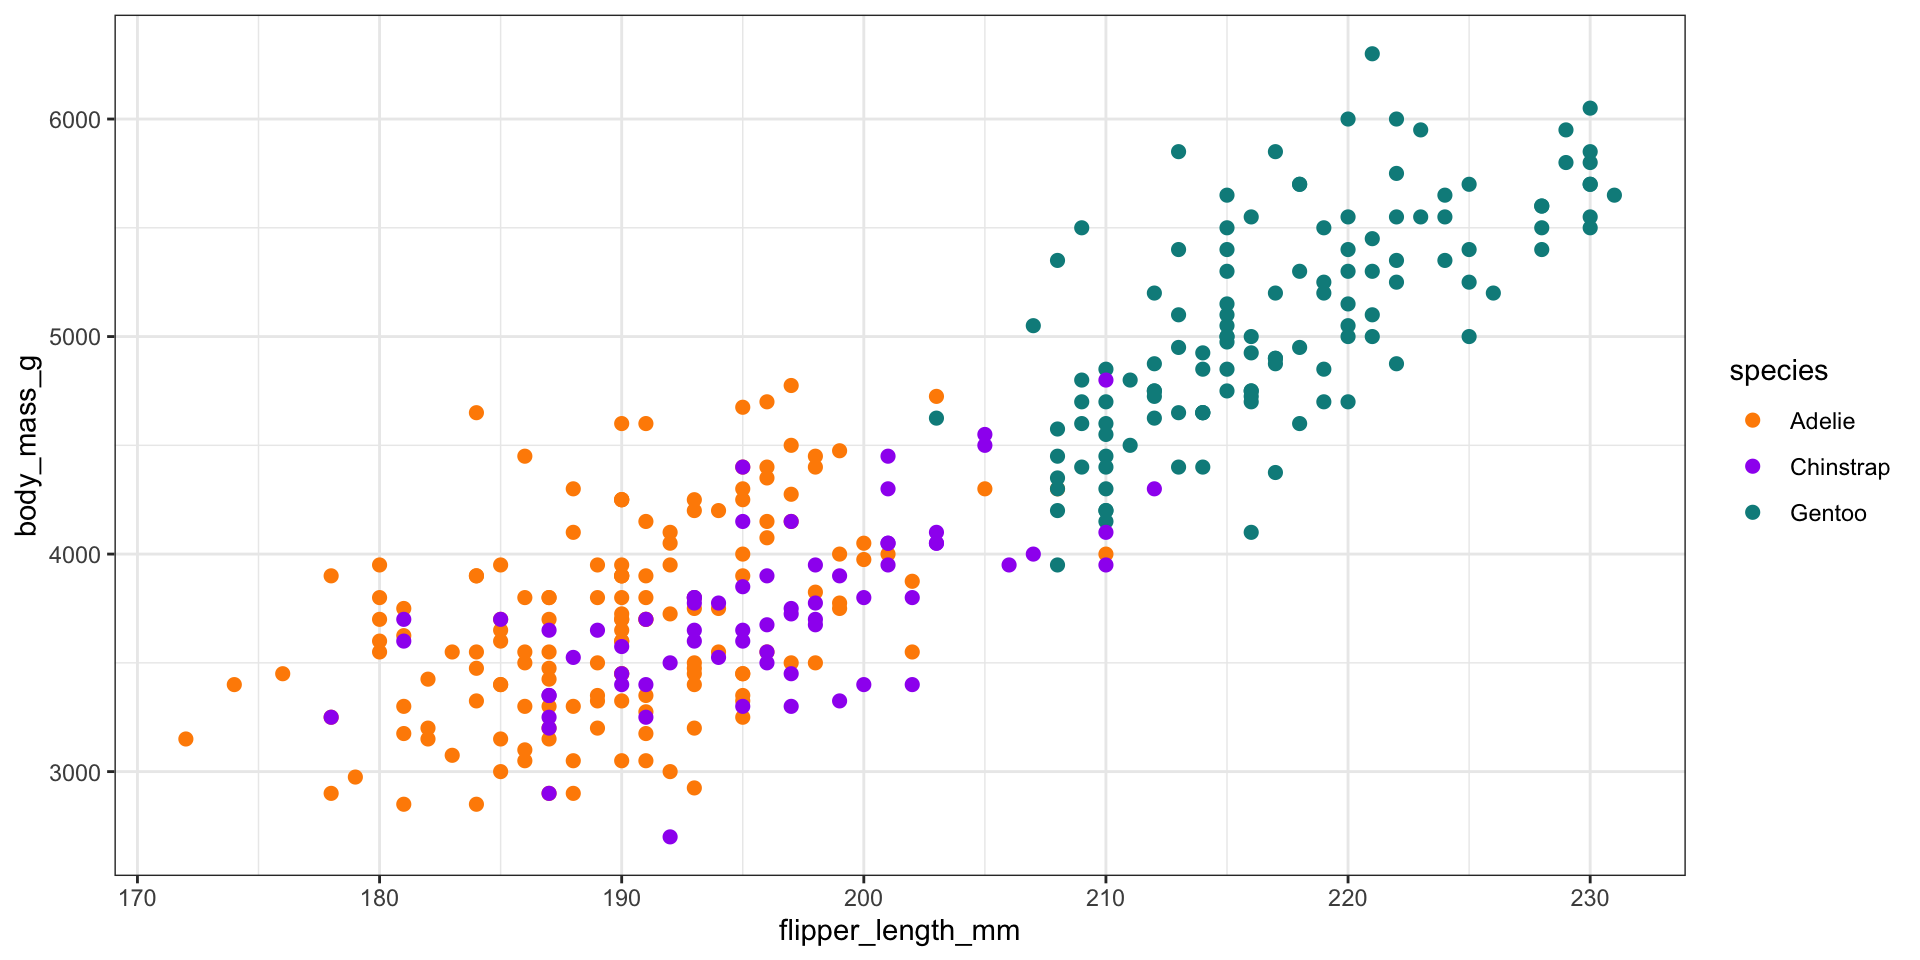
Below is a graph of association between flipper length in millimeters and body mass in grams of three species of penguins in Palmer Station, Antarctica. What are informative title and axis labels for this graph?
Which code chunk would you rather read?
Make code easier to read and debug by
Putting each element on a different line (start a new line after + and |>)
Putting spaces before and after operators (+, -, *, =, |> )
In general, avoiding long lines of code, i.e. lines longer than 80 characters.
See the Tidyverse Style Guide for more tips on code styling.
Today’s lab focuses on using linear regression to explore the relationship between air temperature and ice duration for two lakes in Wisconsin, along with the change in ice duration over time.
There are markers throughout suggesting when to render, commit, and push changes to GitHub. These are to help you start using version control in your workflow.
There are points for having a neatly formatted document and implementing a reproducible workflow